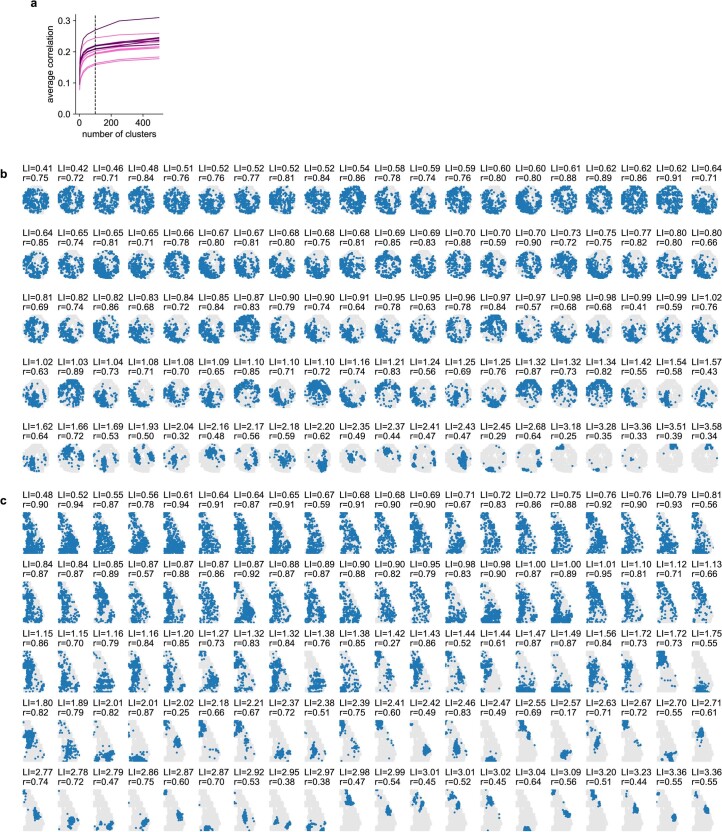
Extended Data Fig. 7. Neural activity clusters from a visual and a sensorimotor recording.
a, Correlation of each neuron with its assigned cluster center across time, averaged across all neurons per recording, as a function of the number of cluster centers used in the clustering algorithm (n = 16 recordings from 12 mice). b, The spatial locations of neurons from each neural activity cluster from the recording shown in Fig. 3d and Fig. 4a,b. Blue indicates neurons in the cluster, and gray indicates all other neurons. LI = locality index, r = correlation with behavior prediction on test data. c, Same as b, for the neural activity clusters from the sensorimotor recording shown in Fig. 3d, Fig. 4c and Extended Data Fig. 6.

