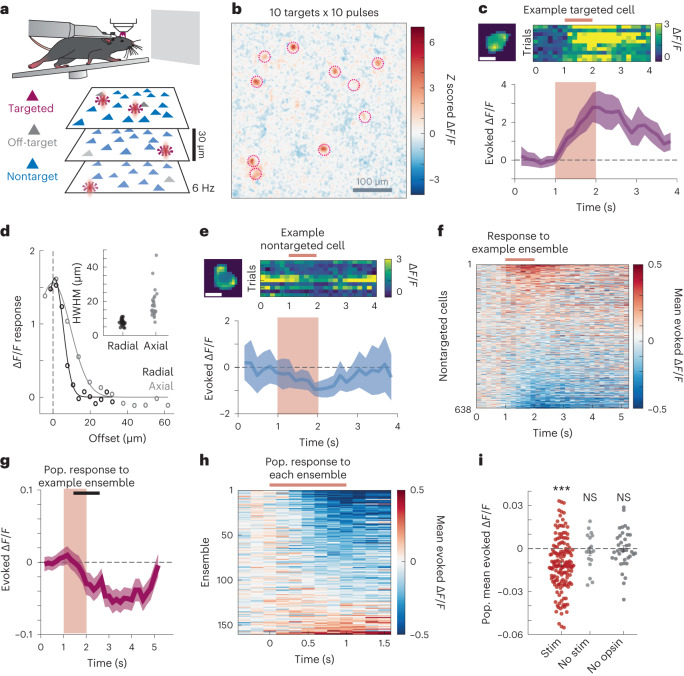
Fig. 1. Stimulation of ten-cell ensembles recruits net suppression.
a, Schematic representation of the experimental setup. Head-fixed mice run on a treadmill in front of a gray screen. Cells from three different planes are imaged at 6 Hz. Cells from any plane can be targeted for photostimulation (magenta), cells adjacent to photostimulated cells (including offset axially) are categorized as ‘off-target’ and excluded (gray), while remaining detected cells are ‘nontarget’ cells and used for analysis (blue). b, Image of the average modulation across three superimposed planes of imaging during stimulation of a representative ten-cell ensemble. Image pixels are z scored over the entire recording and averaged by trial type. c, Response of a targeted cell to photostimulation. Top left, image of the cell mask used in analyses, scale bar 10 µm. Top right, response of this neuron during ten photostimulation trials, stimulation time noted by the maroon bar. Bottom, average evoked calcium response from the same example cell. Mean evoked ΔF/F ± 95% confidence interval (CI). Maroon box denotes the stimulation time (ten pulses at 10 Hz). d, Representative PPSF aligned to peak (dotted line). Inset PPSFs from 25 cells throughout the FOV. e, Response of an example nontarget cell to ensemble stimulation, as in c. f, Mean response of 638 nontarget cells from a single FOV in response to a representative ensemble stimulation. Cells are sorted based on their response magnitude. Stimulation time noted by a maroon bar. g, Mean ± 95% CI of all 638 nontarget cells from f. Maroon box indicates stimulation time, and the black bar indicates the analysis window. h, Population response, that is, mean response of all nontarget cells, in a FOV to 160 unique ten-cell ensembles. n = 160 ensembles, 18 FOVs, 13 mice. i, Mean population response for each ensemble stimulation (maroon, n = 160 ensembles, 18 FOVs, 13 mice), no stimulation controls (gray, n = 18 FOVs, 13 mice), or no opsin controls (black, n = 38 ensembles, 1 FOV, 1 mouse). Mean ± s.e.m. of condition in black. Triple asterisks indicate a significant difference from 0, and NS indicates not significant (stim, P = 1.7 × 10⁻⁸; no stim, P = 0.79; no opsin, P = 0.96; two-sided signed rank test).

