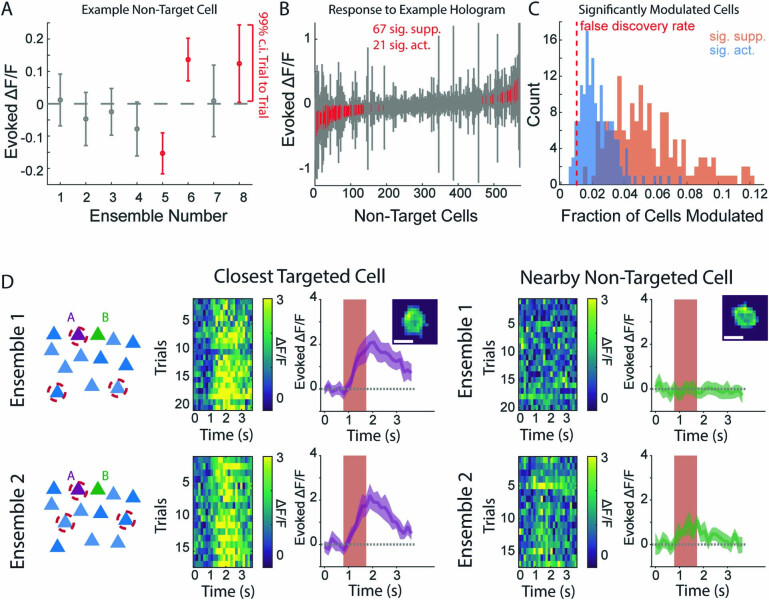
Extended Data Fig. 4. Heterogeneity in responses to holographic stimulation.
a: Evoked ΔF/F responses in a single example non-target cell to 8 distinct 10 cell ensembles stimulations from the same recording. Trial variability presented as mean ± 99% c.i. Significantly modulated conditions (that is, 99% c.i. excludes 0) are marked in red. Each ensemble was stimulated in at least 10 trials (see Methods) b: All non-target cells from a given field of view response to a single example hologram. Mean ± 99% c.i. sorted by mean response. Cells that are significantly modulated (that is, 99% c.i. excludes 0) marked in red. To this hologram 67 cells were significantly suppressed, while 21 were activated. c: For each stimulated ensemble, the fraction of non-target cells significantly activated (blue) or suppressed (orange) (via 99% c.i.) is presented as a histogram. False discovery rate (1%) is noted by the dotted red line. N = 160 Ensembles, 18 FOVs, 13 Mice. d: An example pair of cells that were close to each other (<30 µm) but responded differently to different, but similar, ensembles. Cell A (purple) was targeted in both Ensemble 1 (top) and Ensemble 2 (bottom). Cell B (green) was never directly targeted but was silent in ensemble 1 and driven in ensemble 2. Each row shows a schematic of the ensemble (far left), color plot of the fluorescence observed each trial for cell A (left), mean ± 95% c.i. response for cell A (middle), color plot of the fluorescence observed each trial for cell B (right), and mean ± 95% c.i. response for cell B (far right). Ensemble 1 was repeated in 20 trials, ensemble 2 in 17 trials.

