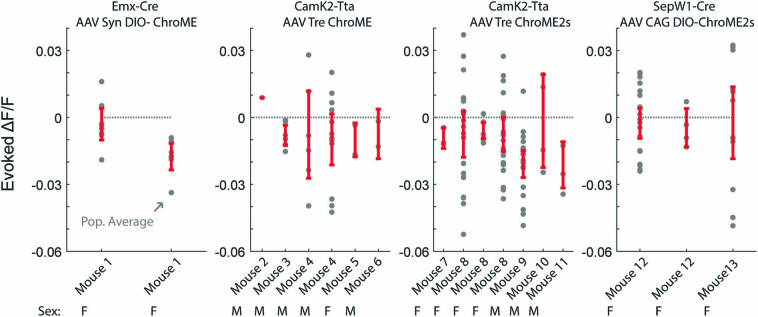
Extended Data Fig. 5. Comparison of effects by mouse and preparation.
Mean population average of all non-targeted cells in response to each 10 cell ensemble stimulation (gray dot). Average ± SEM for each recording FOV in red. Divided by expression selectivity driver (Emx-cre, CamK2-tTA, or SepW1-Cre) and viral construct (Syn-DIO-ChroME, Tre-ChroME, Tre-ChroME2s, or CAG DIO-ChroME2s). Sex of each mouse is noted below. Note SepW1-Cre ensembles are more likely to be spread out, due to the sparse nature. Each dot is the mean response to an ensemble across all conditions N = 160 Ensembles, 18 FOVs, 13 mice.

