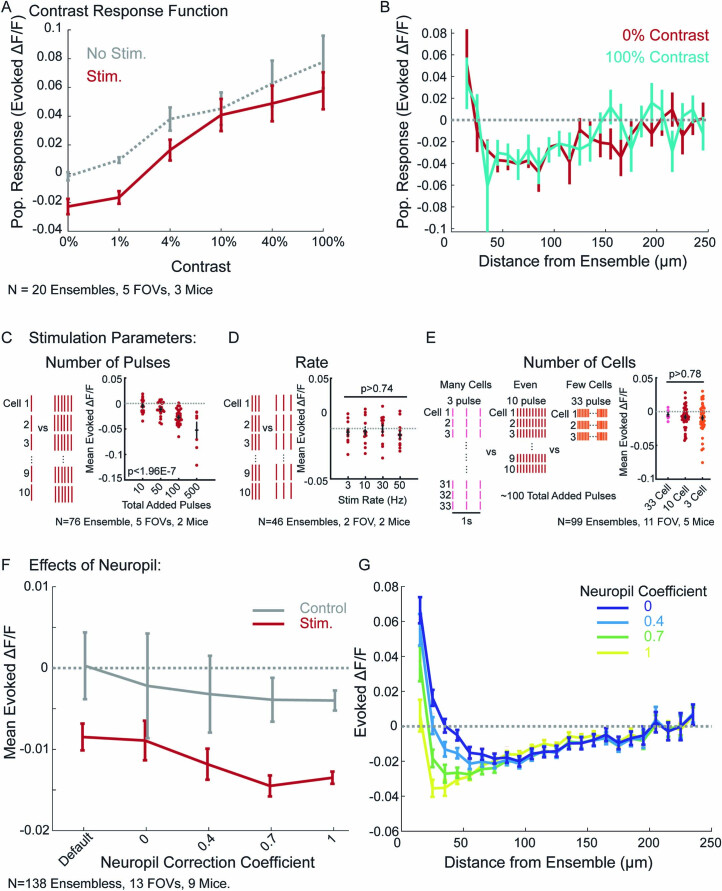
Extended Data Fig. 6. Determining experimental conditions.
a,b Ensemble activation during visual stimulus. a: average population response of all (non-targeted) recorded neurons to visual stimulus alone (Gaussian modulated noise of various contrasts) and with concurrent photo-stimulation of 10 neurons with 10 photo-stimulation pulses. b: Mean population response of all non-targeted neurons as a function of their distance from the photo-stimulated ensemble across 0% and 100% contrast. The mean visual response has been subtracted off to facilitate comparison. All other figures are in the absence of visual stimuli. N = 20 Ensembles, 5 FOVs, 3 Mice. c–e Observed decrease in fluorescence is dependent on the number of spikes added. c: In the absence of visual stimuli, number of total pulses added increased overall mean suppression. Mean evoked population response to 10 cell ensemble stimulation, with 1, 5, 10 or 50 pulses per cell. P = 1.97e-7 1-way ANOVA, N = 76 Ensembles, 5 FOVs, 2 Mice. d: Rate of stimulation did not affect the overall mean suppression. Mean evoked population response to 10 cell ensemble driven with 10 pulses at 3, 10, 30 or 50 Hz. P = 0.74 1-way ANOVA, N = 46 Ensembles 2 FOVs, 2 Mice. e: Number of cells stimulated, when holding number of spikes constant, did not change overall suppression. Ensembles of 33 cells driven with 3 pulses, vs 10 cells driven with 10 pulses, vs 3 cells driven with 33 pulses did not recruit a differential amount of suppression. P = 0.78 1-way ANOVA, N = 99 Ensembles, 11 FOVs, 5 Mice. f,g Neuropil correction does not explain suppression. f: Overall average response of non-targeted neurons (n = 138 ensembles, 13 FOVs, 9 Mice), calculated with a variety of neuropil subtraction coefficients. g: Response of non-targeted neurons as a function of distance from stimulated ensemble members (as in Fig. 2a) calculated with a variety of neuropil subtraction coefficients (same ensembles as panel F). All data presented as mean ± SEM.

