
Fig. 2. Population responses reveal nearby activation and surround suppression, with total recruited suppression dependent on ensemble spread.
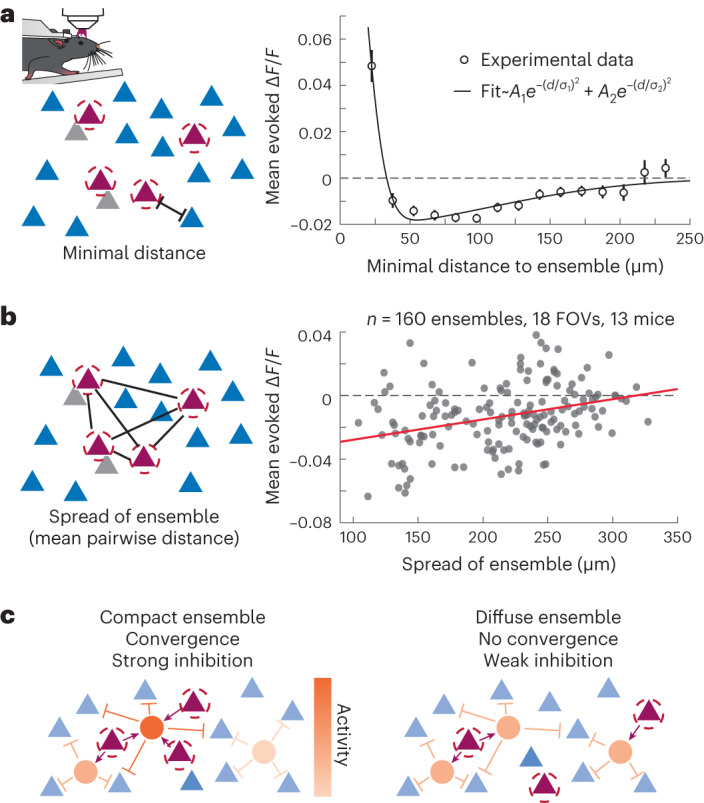
a, Left, schematic representation of the minimal distance metric for nontarget cells (magenta, targeted cells; gray, off-target cells and blue, nontargeted cells). Right, nontargeted cell responses to optogenetic stimulation as a function of minimal distance to ensemble (open circles) fitted to a sum of Gaussian spatial functions (A1 = 0.196, σ1 = 22.1 µm, A2 = −0.021, σ2 = 147.3 µm). Cells near the stimulated ensemble were reliably activated, while cells further away from a target were suppressed (<30 µm from a target mean ΔF/F: 0.044 ± 0.005, P = 1.1 × 10⁻¹⁰; 50–150 µm from a target mean ΔF/F: −0.013 ± 0.001, P = 4.0 × 10⁻¹⁷, two-sided signed rank test). Bin sizes are 15 µm. Mean ± s.e.m. b, Left, schematic representation of ensemble spread metric (mean pairwise distance). Right, nontargeted cell responses averaged across the population (n = 160) for ensembles with different spreads. Activating a spatially compact ensemble drives more surround suppression than stimulating a spatially diffuse ensemble (linear regression of mean ΔF/F versus spread slope: 1.3 × 10⁻⁴ ΔF/F per µm spread, P = 1.4 × 10⁻⁵). c, Schematics illustrating the ability of the targeted cells to activate inhibitory pathways via convergences for compact (left) and diffuse (right) ensembles.