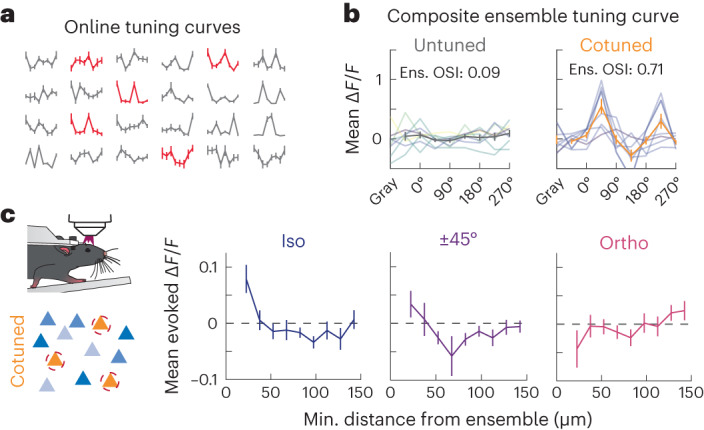
Fig. 3. The relative match of orientation tuning of nontargeted cells to the tuning of a stimulated ensemble determines their modulation.

a, Representative tuning curves (computed online) from 24 nontargeted cells. Each point of each curve is the mean ± s.e.m. normalized calcium response to a drifting grating. Red tuning curves are for cells that were selected to compose an individual ensemble. b, Two representative ensemble tuning curves. Left, a representative untuned ensemble (n = 8 cells). Right, a representative cotuned ensemble (n = 7 cells). Individual tuning curves lighter colors, mean ± s.e.m. dark bold colors. All ensembles are composed of a mix of visually responsive, tuned and unresponsive cells to create an ‘ensemble’ matching its desired features. c, Left, schematic representation showing photostimulation of a cotuned ensemble. Right, nontargeted cell responses ±s.e.m. as a function of their minimal distance to the targeted ensemble, split according to their relative tuning with respect to the ensemble tuning of the targeted ensemble (left, Δθ = 0° (iso); middle, Δθ = ±45° and right, Δθ = 90° (ortho)). Included cells were responsive to visual stimuli (P < 0.05) and tuned (OSI > 0.25). Nearby iso-oriented cells (<30 µm) are activated more than those cells that prefer orthogonal stimuli (P = 0.0035, Wilcoxon one-sided ranked-sum test, n = 17 ensembles, 8 FOVs, 3 mice). Bin sizes are 15 µm.
