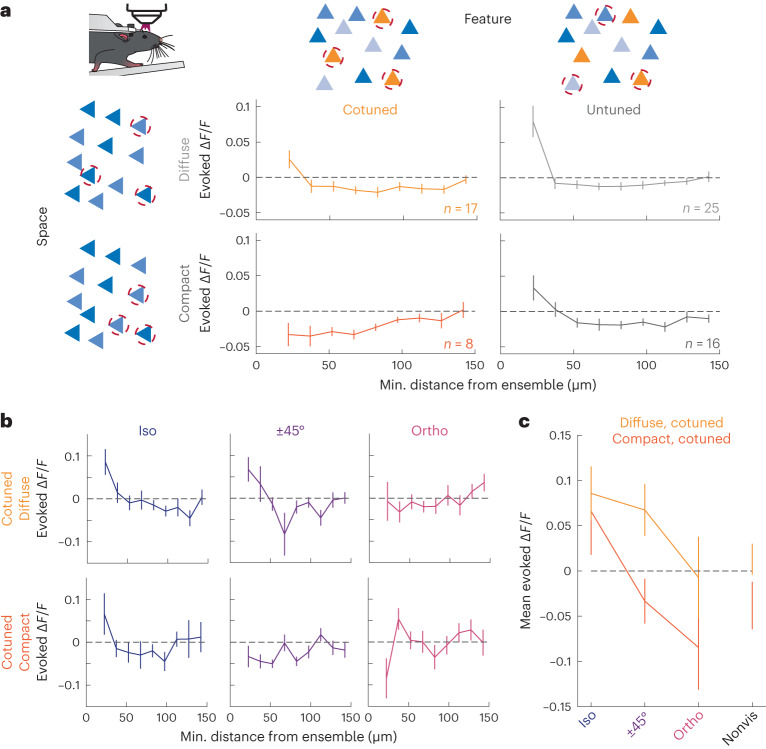
Fig. 4. Space and feature properties of the photostimulated ensemble jointly control recurrent activity.
a, Ensembles are divided into two categories as follows: in rows whether they are diffuse (mean distance >200 µm, top) or compact (<200 µm, bottom) versus in columns whether they are cotuned (Ens. OSI > 0.7, left) or untuned (<0.3, right). Schematics by the axes describe the ensemble design in that row/column. Data presented are mean nontargeted cell responses ± s.e.m. as a function of their minimal distance to the ensemble. Diffuse cotuned n = 17 ensembles, 9 FOVs, 3 mice; diffuse untuned n = 25 ensembles, 13 FOVs, 3 mice; compact cotuned n = 8 ensembles, 3 FOVs, 1 mouse; compact untuned n = 16 ensembles, 7 FOVs, 2 mice. b, Data from the left two panels of a now split by relative orientation tuning to the cotuned ensemble. Response plots of cotuned ensembles divided by mean separation (as in a), but nontargeted cells are separated by relative tuning with the stimulated ensemble (left, Δθ = 0° (iso); middle, Δθ = ±45° and right, Δθ = 90° (ortho), n = 17 diffuse and cotuned ensembles, from 9 FOVs, 3 nice, n = 8 compact and cotuned ensembles, from 3 FOVs, 1 mouse). c, Similar to b, mean response of nontargeted cell responses during stimulation of diffuse, cotuned (n = 17) and compact, cotuned (n = 8) ensembles. Here data shown are from each of the first spatial bins of the six panels in b as a function of their relative tuning with the stimulated cotuned ensembles. All data are presented as mean ± s.e.m.

