
Fig. 5. Mathematical model can capture nearby activity and surround suppression.
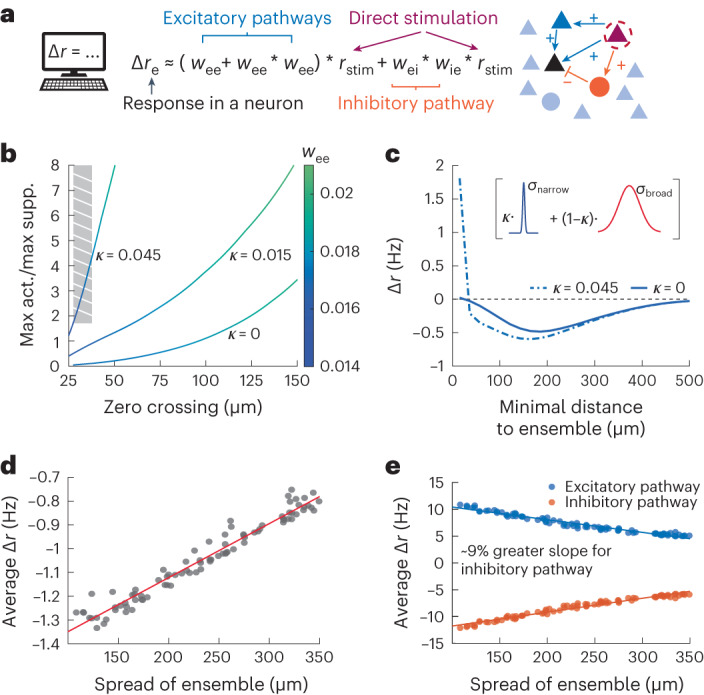
a, Schematic representation of all monosynaptic and disynaptic pathways resulting in a change in the baseline firing rate (blue, excitatory pathways and orange, inhibitory pathways). An asterisk denotes convolution in space. b, The zero crossing and relative strength of nearby activation (maximum activation/maximum suppression) as a function of recurrent excitatory strength (wee) and biased connections on the narrow spatial scale (κ). The gray stripe box indicates the experimentally observed data regime and illustrates the need for additional spatial constraints to capture the nearby activation observed in the data. c, Modulation of the activity of nontargeted cell responses in the model as a function of minimal distance to ensemble for different values of κ. Inset, schematic representation shows the narrow versus broad spatial scales in the model (see Methods for more details). d, Same as Fig. 2b except for the network model. e, Strength of the model excitatory (blue) and inhibitory (red) pathways as a function of ensemble spread, showing that as the ensemble spread decreases, the inhibitory pathway shows a greater level of recruitment.