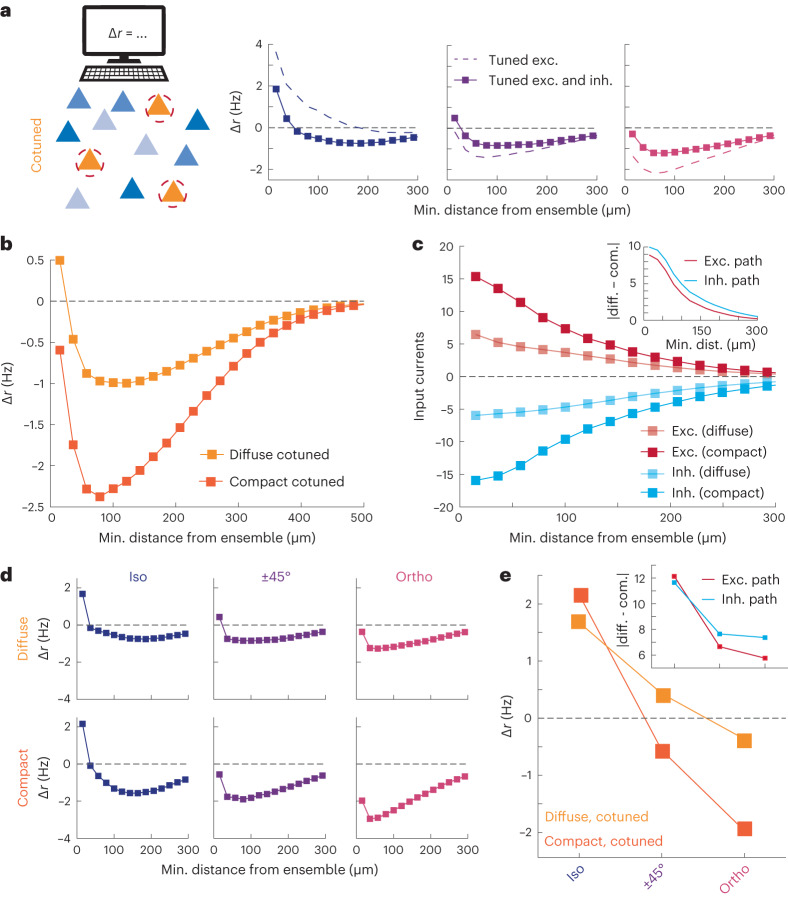
Fig. 6. Network model with both spatial- and feature-based tuned connections wiring rules can recapitulate core experimental results.
a, Same as Fig. 3c, except for the network model with (solid) and without (dashed) tuned E→I connections. b, Nontargeted cell responses in the network model as a function of their minimal distance to the ensemble according to the ensemble spread and tuning. c, The excitatory (red) and inhibitory (blue) input pathways for the spatially diffuse and compact cotuned ensembles. Inset, absolute difference of excitatory and inhibitory paths showing that while both pathways increase in magnitude for compact ensembles, the inhibitory pathway shows a larger increase. d, Nontargeted cell responses in the network model as a function of their minimal distance to the ensemble according to their relative tuning with the stimulated cotuned ensembles. e, Nontargeted cell responses from the first bin of panel d as a function of their relative tuning with the stimulated cotuned ensembles. Inset, absolute difference of excitatory and inhibitory pathways.

