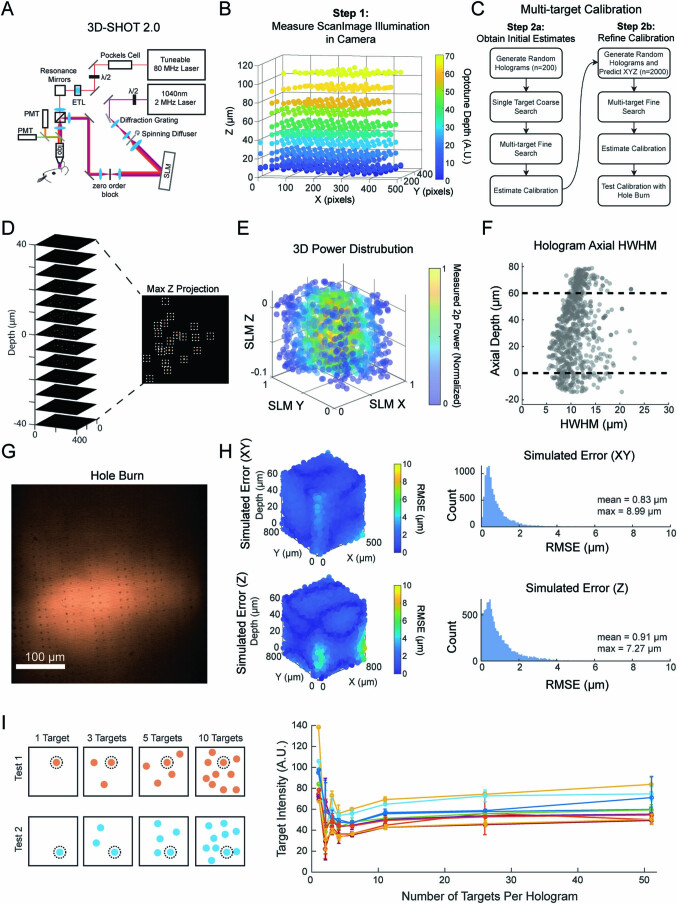
Extended Data Fig. 2. 3D-SHOT2.0 and 3D spatial calibration.
a: Microscope setup implementing simultaneous holographic optogenetics (via 3D-SHOT 2.0) and 2-photon calcium imaging. Imaging and stimulation paths are co-aligned and calibrated using the procedure outlined in this figure. b: First, a substage camera is used to image the ‘imaging’ fields of view in three dimensions. A thin fluorescent slide is imaged by the camera, and the microscope focus moved above and below the slide to gain depth information. The field curvature, introduced by the ETL, among other elements, was measured as a function of XY position and depth and then fit with a polynomial. Multiple ETL offsets representing the different imaging planes that might be used in an experiment are imaged separately. c: Second, we devised a multiplexed approach to register the position and diffraction efficiency of hologram targets (aka individual illuminated spots) throughout the Imaging FOV. To begin, the approximate XYZ position of 200 randomly selected single-target holograms was determined by imaging a with the substage camera. Each hologram was projected onto the thin film slide, and then a z-stack of images made by defocusing the microscope. The XY position of each hologram was determined by the position on the camera, while the Z position inferred from the stack. Next, multi-target holograms comprised of the holograms imaged in the initial phase were imaged at a higher resolution to provide a more accurate XYZ position. By imaging holograms as multi-targets we were able to parallelize data acquisition and dramatically improve calibration times. Next, we use the initial 200 imaged holograms to estimate the calibration and registration of holograms in the imaging FOV. Using these initial model fits, we then generate 100 20-target holograms (for a total of 2000 data points), predict their location in the substage camera, and extract the resulting XYZ position, relative power, and HWHM throughout the entire imaging FOV. Data were fit with a polynomial to generate a general transform for any SLM and imaging coordinate. Finally, we test the spatial calibration with an automated ‘hole-burn’ (n = 300 holes burnt during calibration). d. An example of a multi-target hologram being imaged in a stack. e: Example power distributions in 3D (presented in arbitrary SLM units). Power distributions vary significantly throughout 3D space. By modeling hologram diffraction efficiency in 3D, we can dynamically compensate power during an experiment to accurately use a greater range of the SLM. Each point represents a single imaged hologram; color represents the relative power from that hologram. f: Axial hologram HWHM varies as a function of depth. We co-aligned the axial position of the imaging and holographic stimulation pathways such that the holograms with smallest HWHM were positioned within the typical Imaging axial range used in experiments (dashed lines). Each point represents a single imaged hologram. g: Example image from the automated ‘hole-burn’. A unique pattern is bleached/burned onto a thin fluorescent slide, imaged in ScanImage, and the XY position of hole-burn locations is detected. This process is repeated for multiple z-planes. A ‘hole-burn’ image is taken for each hole, consequently this image is one of ∼300 images per calibration, and representative of the burns made in all >5 Calibrations performed over this project. h: With the calibration in place, we simulated XY (top) and Z (bottom) error in targeting throughout the typical imaging field of view (n = 10,000 simulations). Root-mean-square error (RMSE, in µm) is presented in 3D (left) and overall error distributions (right). i: To understand the variability in delivered power across different types of holograms, we measured the fluorescence evoked by a series of 10 test targets (dotted circle, left). Using the substage camera, we measured the intensity from the test target alone in a single-target hologram, or in a hologram that also contained 1 to 50 randomly chosen ‘distractor’ targets, 10 repeats with new distractor targets were performed per test target and hologram size. Right, the intensity of each test target as a function of the total number of targets in the hologram. Each color denotes a different test target, while the variability comes from different ‘distractor’ targets (presented as S.E.M).

