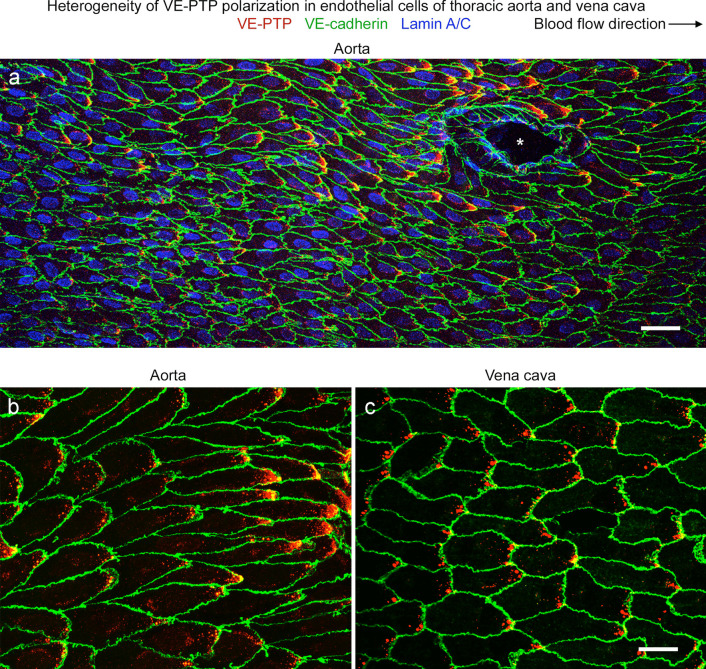
Fig. 1.
Heterogeneity of VE-PTP downstream polarization in aorta and vena cava. a–c Confocal microscopic images of immunohistochemical staining for VE-PTP (red), VE-cadherin, (green), and nuclei (blue, lamin A/C) of endothelial cells in the descending thoracic aorta near an intercostal artery ostium (asterisk) (a, b) and inferior vena cava between the right atrium and diaphragm (c). Blood flow is left to right. VE-PTP is concentrated in the downstream half of endothelial cells, but the amount varies from cell to cell. A conspicuous patch of VE-PTP is located near the downstream tip of some endothelial cells but not in others. Downstream concentrations of VE-PTP are larger in the aorta (a, b) but are more frequent in the vena cava (c). Scale bars: a 50 µm, b, c 20 µm

