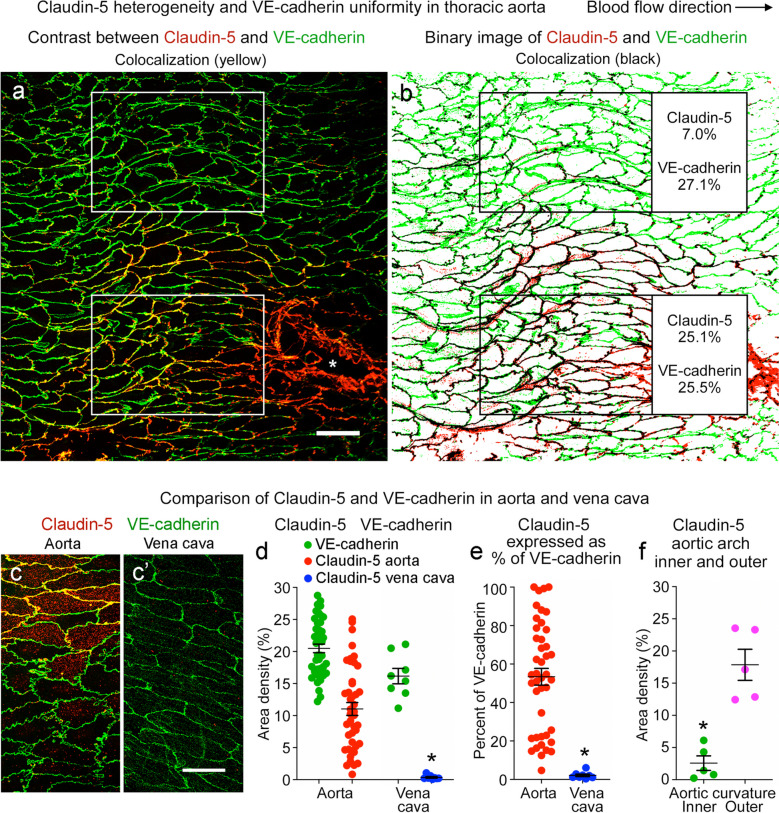
Fig. 10.
Claudin-5 heterogeneity in aorta and absence in vena cava. a Confocal microscopic image of a region of descending aorta upstream to an intercostal artery ostium (asterisk) illustrating the heterogeneity of claudin-5 (red) and the uniform distribution of VE-cadherin (green) in endothelial cells. Blood flow left to right. Scale bar: 50 µm. b Color-coded binary version of image (a) showing amounts of claudin-5 and VE-cadherin in boxed regions. In the upper box, claudin-5 (area density 7.0%) was only 26% of VE-cadherin (area density 27.1%), but in the lower box claudin-5 (area density 25.1%) was 98% of VE-cadherin (area density 25.5%). c, c’ Confocal microscopic images comparing amounts of claudin-5 (red) and VE-cadherin (green) in thoracic aorta (c) and inferior vena cava (c’). Claudin-5 staining is patchy in the aorta and absent in the vena cava. Scale bar: 20 µm. d Measurements comparing the heterogeneity in amount of claudin-5 and VE-cadherin staining in the aorta and vena cava. e Dot plots showing amount of claudin-5 in the aorta and vena cava expressed as percent of VE-cadherin. *P < 0.0001 by Student’s t test. Mean ± SEM, n = 43 regions of aorta in 10 mice and n = 8 regions of vena cava in 5 mice. f Area density of claudin-5 in the inner and outer curvatures of aortic arch. *P < 0.001 by Student’s t test. Mean ± SEM, n = 5 images of each region of aortic arch and 9 images of vena cava in 5 mice

