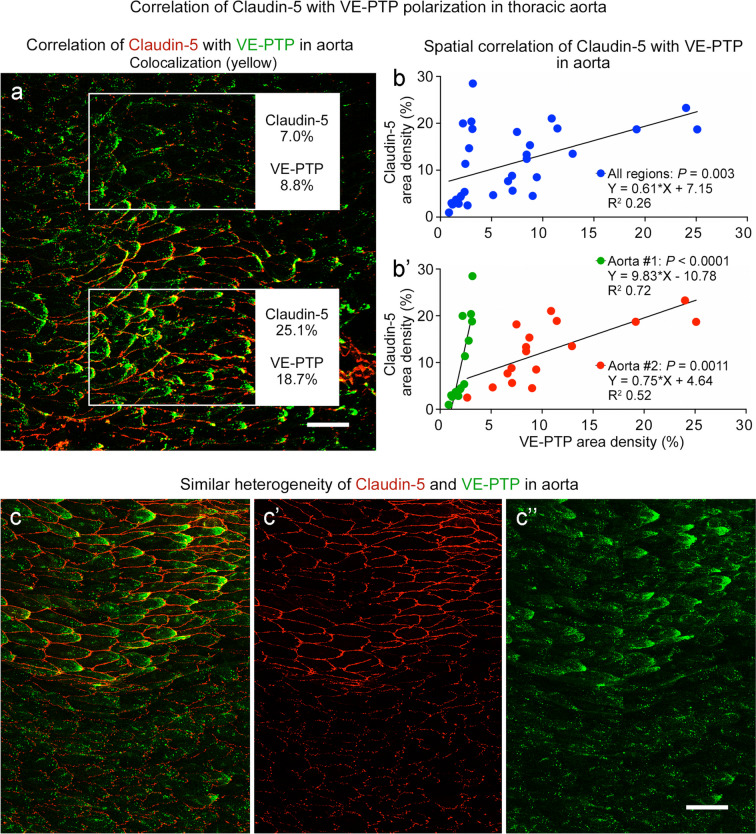
Fig. 11.
Claudin-5 and VE-PTP correlation in endothelial cells of aorta. a Confocal microscopic image of the aortic region shown in Fig. 10a, here comparing claudin-5 (red) and VE-PTP (green) staining. Upper box shows a region with little claudin-5 or VE-PTP. Lower box shows an adjacent region with abundant claudin-5 and VE-PTP. Claudin-5 and VE-PTP area densities are shown in outlined regions. Scale bar: 50 µm. b, b’ Linear regression plots showing significant correlation of claudin-5 and VE-PTP in endothelial cells in two aortas. b shows values for 32 regions plotted together (P = 0.003). b’ shows the same values plotted separately for the two aortas. Claudin-5 and VE-PTP are significantly correlated in both curves, but the slopes are different. Aorta #1, P < 0.0001, n = 15 regions. Aorta #2, P = 0.0011, n = 17 regions. c–c’’ Confocal microscopic image of claudin-5 (red) and VE-PTP (green) in aorta, shown here together (c) and separately (c’ claudin-5, c’’ VE-PTP), to illustrate the similar heterogeneities in another aorta (Aorta #5, Fig. 12a’’, a’’’’’) that was sampled around the entire circumference. Scale bar: 50 µm

