Fig. 3.
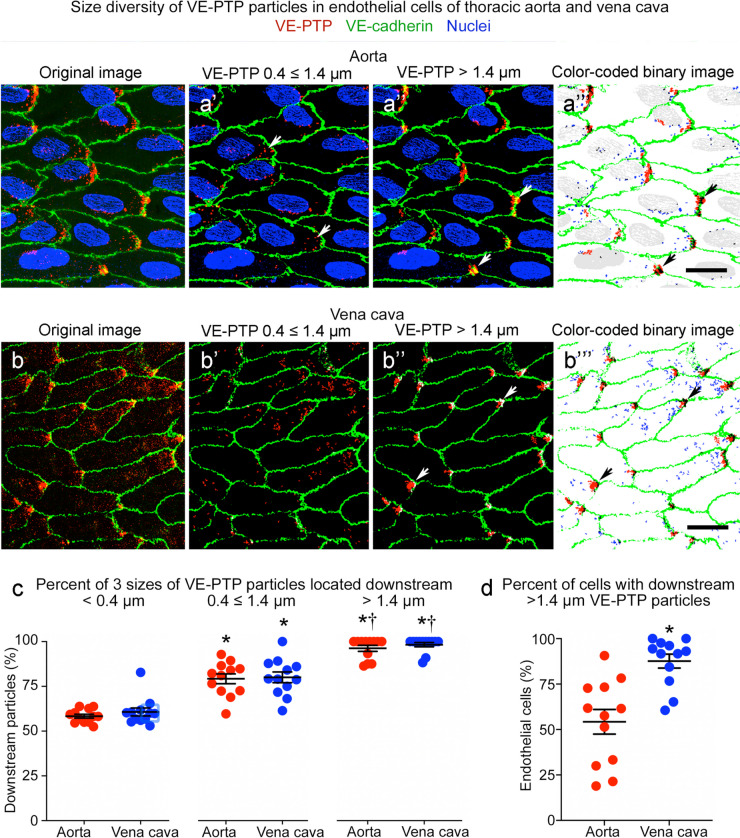
Size differences in VE-PTP particles polarized downstream in aorta and vena cava. a–a’’’ Confocal microscopic images of VE-PTP (red), VE-cadherin (green), and nuclei (blue, lamin A/C) in thoracic aorta comparing the original image (a) to binary images of VE-PTP particles with diameters of 0.4 ≤ 1.4 µm (a’) or > 1.4 µm (a’’) and color-coded composite of the 0.4 < 1.4 µm (blue) and > 1.4 µm (red) binary images (a’’’). Blood flow left to right. VE-PTP particles 0.4 ≤ 1.4 µm in diameter are scattered in the downstream cytoplasm, whereas VE-PTP particles > 1.4 µm are concentrated at the downstream cell tip (arrows). b–b’’’ Images of vena cava stained as in (a–a’’’). Arrows mark VE-PTP at the downstream cell tip. Scale bars: 10 µm. c Percentages of 3 sizes of VE-PTP particles in the downstream half of endothelial cells in the aorta and vena cava. *P < 0.05 compared to < 0.4-µm group; †P < 0.05 compared to 0.4 ≤ 1.4 µm group, by one-way ANOVA followed by Tukey’s multiple comparison test. Mean ± SEM, n = 12 images from 6 mice/group. d Dot plots showing percentages of endothelial cells with > 1.4 µm VE-PTP particles with significantly larger values for the vena cava than for the aorta. *P < 0.05 by Student’s t test. Mean ± SEM, n = 12 images from 6 mice/group

