Fig. 7.
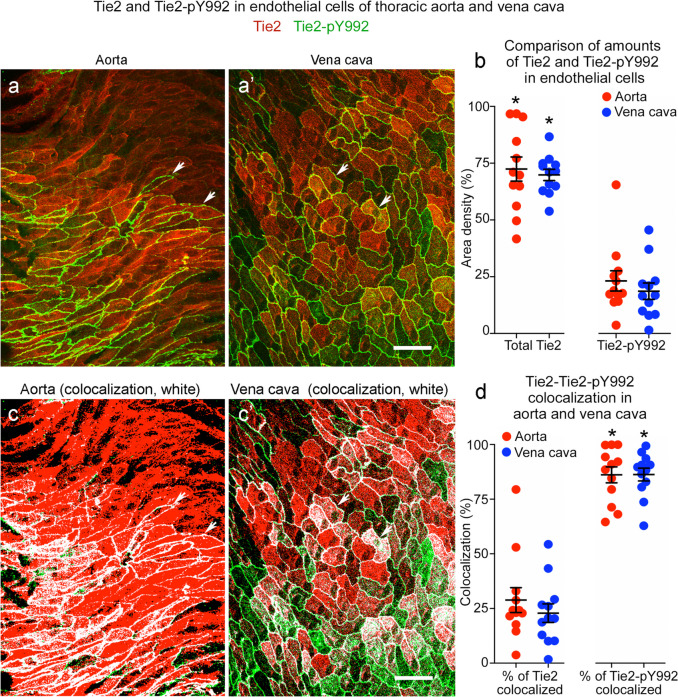
Tie2-pY992 has a restricted distribution in relation to Tie2 in aorta and vena cava. a, a’ Confocal microscopic images of total Tie2 (red) and Tie2-pY922 (green) staining in endothelial cells of the descending thoracic aorta (a) and vena cava (a’). Tie2 is much more widespread than Tie2-pY992, which is restricted to a subset of endothelial cells. Scale bar: 20 µm. b Measurements documenting the broader distribution of Tie2 than Tie2-pY992 and similarity of amounts of both in the aorta and vena cava. c, c’ The same images as in (a, a’), here showing the distribution of Tie2-pY992/Tie2 colocalization (white) in the aorta (c) and vena cava (c’). Scale bar: 20 µm. d Measurements of Tie2-pY992/Tie2 colocalization expressed as the percent of Tie2 colocalized (left dot plots) and percent of Tie2-pY992 colocalized (right dot plots). The plots show that 86% of Tie2-pY992 colocalized with Tie2 (right), but only 29% of Tie2 in aorta and 23% of Tie2 in vena cava colocalized with Tie2-pY992 (left). *P < 0.05 by one-way ANOVA followed by Tukey’s multiple comparison test. Mean ± SEM, n = 12 images from 6 mice/group

