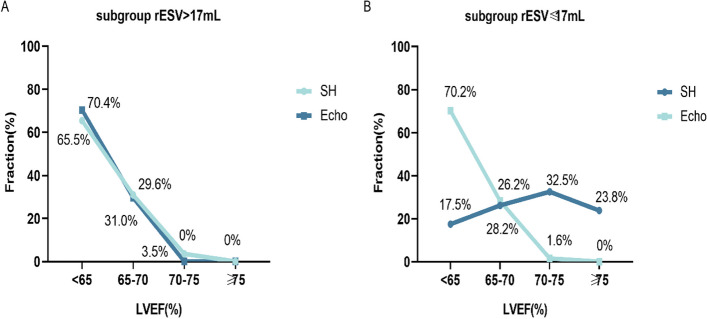
Fig. 7.
The distribution of LVEF values over four intervals calculated using the SH protocol and Echo. A In the rESV > 17 mL subgroup, the SH protocol and Echo were used to measure a consistent distribution of LVEF across three ranges. B In the rESV ≤ 17 mL subgroup, the SH protocol and Echo were used to measure an inconsistent distribution of LVEF across three ranges. The “Fraction” on the y-axis was defined as the proportion of the number of patients in the total study population

