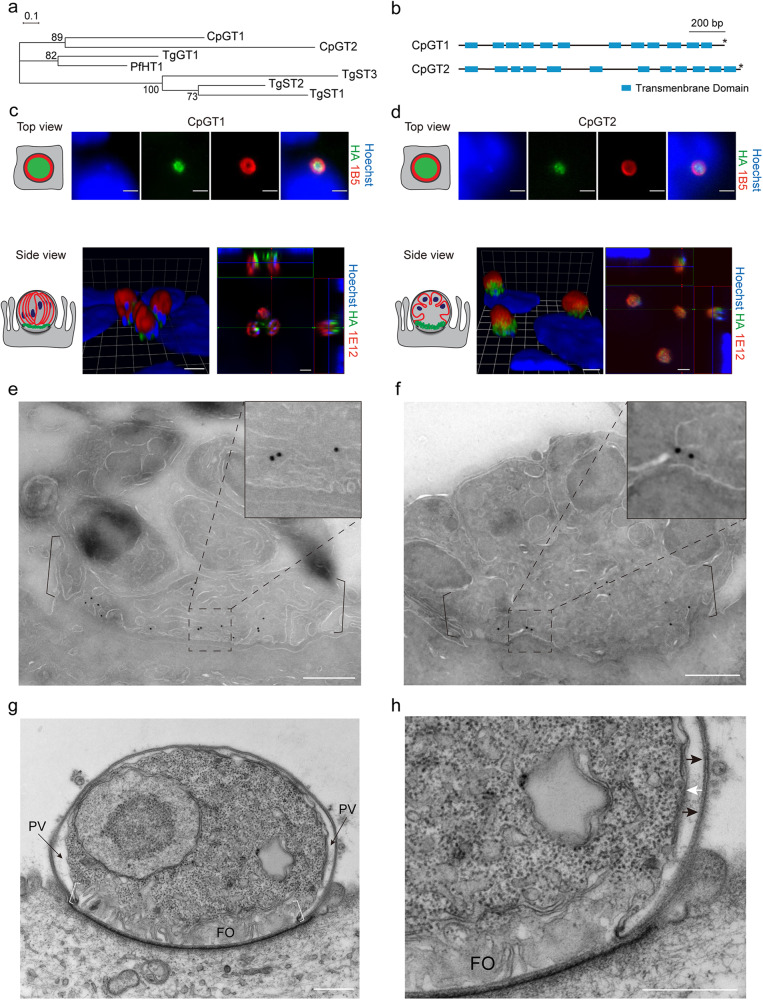
Fig. 1. Cryptosporidium parvum contains two putative glucose transporters CpGT1 and CpGT2 localized to the feeder organelle.
a Phylogenetic relationship of C. parvum (Cp) putative glucose transporters CpGT1 (gene ID: cgd3_4070), CpGT2 (gene ID: cgd4_2870), Plasmodium falciparum hexose transporter PfHT1, and Toxoplasma gondii glucose transporter TgGT1 and sugar transporter TgST1-3. The tree was constructed by a maximum likelihood method and JTT matrix-based model with 1,000 replications for bootstrapping. Scale bar = 0.1 of substitutions per amino acid site. b Schematic representation of the domain structure of CpGT1 and CpGT2 including putative transmembrane domain (blue) and stop codon (*). c, d Immunofluorescence localization of CpGT1-3HA (left) and CpGT2-smHA (right) in trophozoite (top view) and meront stages (side view) grown on HCT-8 cells. See also supplementary Fig. 1a. For trophozoite staining, cells were fixed at 4 hours post infection (hpi) and stained with rat anti-HA (green), mouse 1B5 (red) and Hoechst (blue). For meront staining, cells were fixed at 24 hpi and stained with rat anti-HA (green), mouse 1E12 that recognizes a surface membrane protein (red) and Hoechst (blue). The experiment was performed twice with similar results. Scale bars = 2 µm. Cartoon images to the left of IFA panels illustrate plasma membrane (red) and transporters (green) in trophozoites (top, parasite nucleus has been omitted as it is out of the plane of focus) and mature meront (bottom left) and immature meront (bottom right). e, f Ultrastructural localization of CpGT1-3HA (left) and CpGT2-smHA (right). Parasites were grown in HCT-8 cells, fixed at 20 hpi and processed for immuno-EM and stained with rabbit anti-HA followed by 18-nm colloidal gold goat anti-rabbit IgG. Similar results were seen in multiple sections from one experiment. Scale bars = 500 nm. See also supplementary Fig. 3. g Transmission electron micrograph of C. parvum trophozoite showing the parasitophorous vacuole (PV) space and membranous feeder organelle (FO). Similar results were seen in multiple sections from one experiment. Scale bar = 500 nm. h Enlargement showing the organization of the parasitophorous vacuole membrane (black arrows) the parasite plasma membrane (white arrows) and the feeder organelle (FO). Mouse intestinal spheroids were cultured on transwells to create the air-liquid interface culture. Cells were infected with wild type parasites and monolayers were fixed and processed at 1 dpi. Scale bar = 500 nm.

