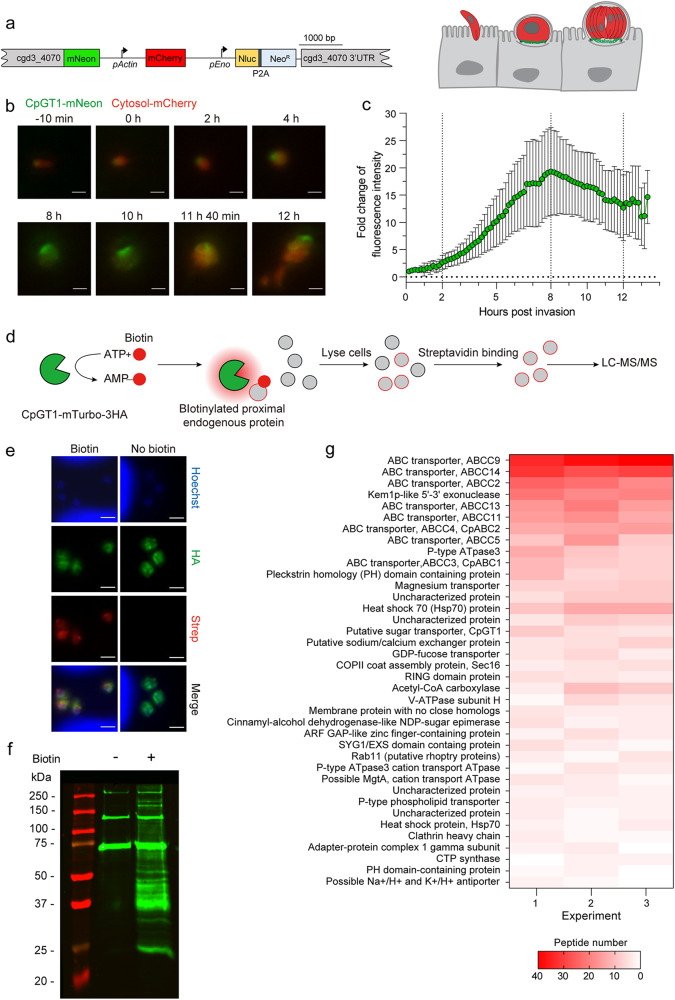
Fig. 2. Formation of the C. parvum feeder organelle and proximity labeling of enriched transporters.
a Schematic representation of CpGT1-mNeon-mCherry transgenic Cp strain. CpGT1 fused to mNeon and mCherry driven by Cp actin promoter. Cartoon depicts the labeling of the feeder organelle with CpGT1-mNeon and the cytosol with mCherry. b Time lapse microscopy at intervals during the merogony cycle. Scale bars = 2 µm. See also Supplementary Movie 1 for the time-lapse series of a full merogony cycle. c Fold change in fluorescent intensity of mNeon at time intervals during merogony normalized to 0 h post invasion. Each bar represents the mean ± SD for a total of 15 parasites from three combined experiments. d Schematic representation of proximity-dependent biotinylation in Cp. HCT-8 cells were infected with CpGT1-mTurbo-3HA parasites, labeled with biotin, lysed and affinity purified using streptavidin beads, and captured proteins identified by LC-MS/MS. See also Supplementary Fig. 1d for constructing and identification of CpGT1-mTurbo-3HA transgenic parasites. e Immunofluorescence of biotin-labeled parasites grown in HCT-8 cells. Cells were infected with CpGT1-mTurbo-3HA parasites. After 19 h post infection, cells were treated with 500 µM biotin or vehicle (DMSO) for 1 h, then fixed and stained with rat anti-HA (green), streptavidin-Alexa 568 (red) and Hoechst (blue). The experiment was performed twice with similar outcomes. Scale bars = 2 µm. See also Supplementary Fig. 5 for immunofluorescence of biotin-labeled wild type parasite with anti-HA and streptavidin staining as a negative control. f Western blot analysis of biotinylated proteins in Cp cell lysates. Cells were infected with CpGT1-mTurbo-3HA parasites. After 19 h, cells were treated with 500 µM biotin or vehicle (DMSO) for 1 h, lysed in 1% NP-40 lysis buffer, captured on streptavidin beads and detected by Western blot with IRDye 800CW-labeled streptavidin (green). The experiment was performed three times with similar results. g Heat map of interactors of CpGT1 identified by mass spectrometry. Data were from three independent experiments including proteins ( ≥ 2 peptides, 95% peptide threshold, 99% protein threshold) with significant and 2-fold enrichment in biotin versus in vehicle (P < 0.05, unpaired Student’s t tests, two-tailed). The numbers of peptides in biotin samples from three experiments were shown on the heat map. The list of gene ID is provided in Supplementary Data 1. Source data are provided as an accompanying Source Data file.

