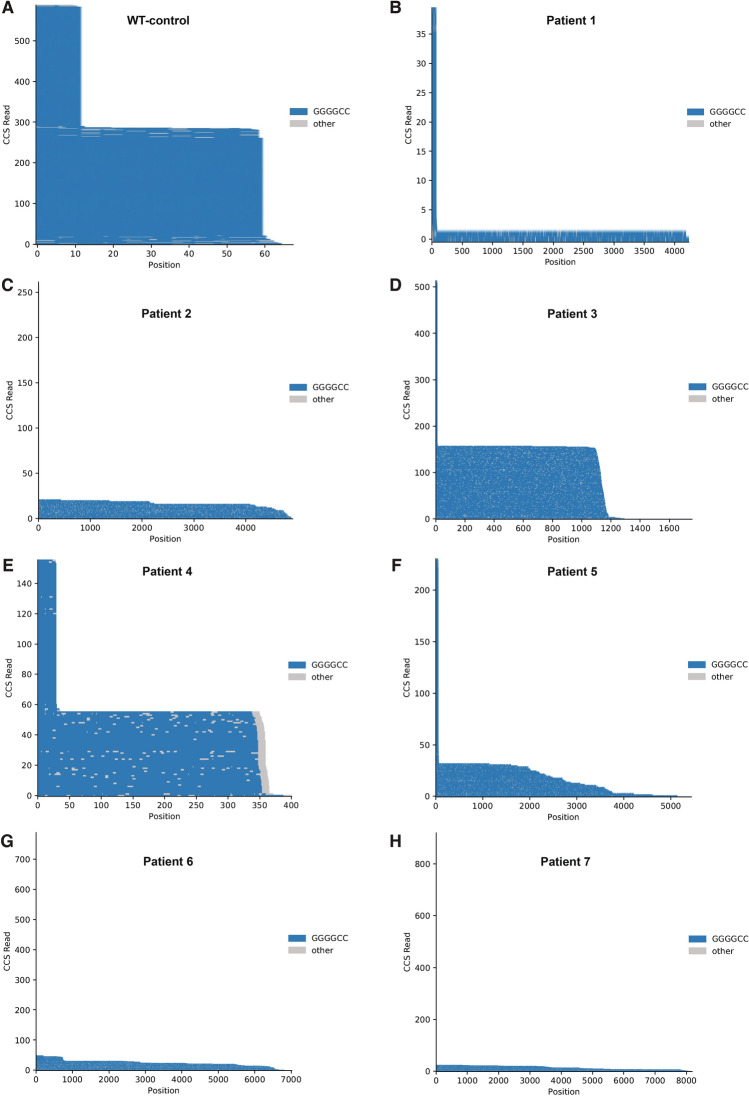
Figure 2.
Pacific Biosciences (PacBio) single-molecule sequencing traces of the C9orf72 repeat region for patient and control cell lines. (A–H) Sequencing traces showing the number of circular consensus sequencing (CCS) reads per repeat count. In the sequencing traces, each horizontal line represents one sequenced molecule of DNA. Blue color depicts on-target sequencing with GGGGCC repeat, grey color depicts sequencing error. Each molecule is anchored to an adjacent, non-repeat region (CGCCC) which is not included In the total repeat count. Y-axis = CCS count. In the WT line, repeat length has a bimodal distribution with roughly equal numbers of reads containing 2 or 10 repeats, indicating that one allele has 2 repeats and the other 10. In the patient lines, a bimodal distribution is present but not always as apparent: all lines show a peak with a low repeat number (2–10), corresponding to the unexpanded allele, and the expanded allele size can vary across cell lines from different donors.

