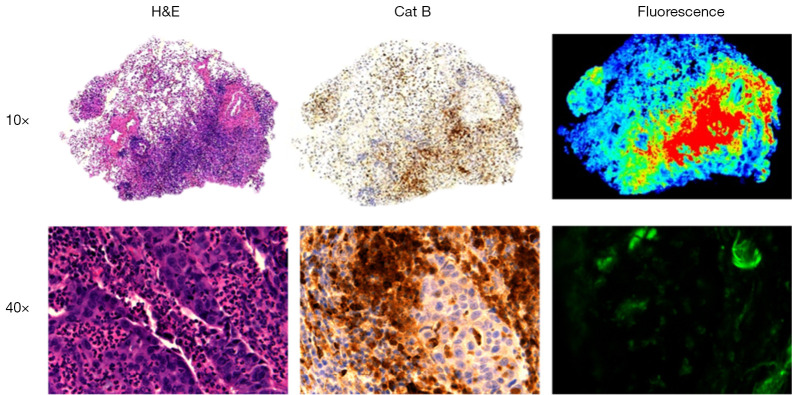
Figure 3.
Histologic evaluation of resected specimen. The first column represents the hematoxylin-eosin slide of the resected tumor with staining of the tumor nuclei. The second column corresponds to cathepsin B staining of the same specimen. The third column represents microscopic fluorescence imaging capturing areas stained by VGT-309 (green). The bar represents 50 µM. H&E, hematoxylin and eosin; Cat B, Cathepsin B.

