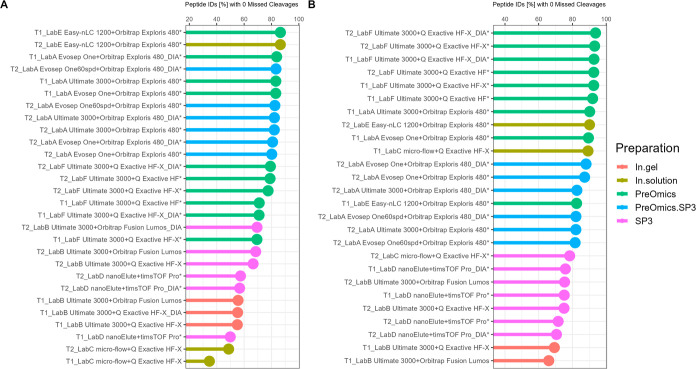
Figure 6.
T1 vs T2—proportion of peptide IDs [%] with zero missed cleavages for plasma (A) and CSF (B). Results are color coded by the sample preparation procedure and ranked in the decreasing order. Also, workflows denoted with an asterisk used a preparation strategy including LysC-trypsin digestion, and others used trypsin digestion only.

