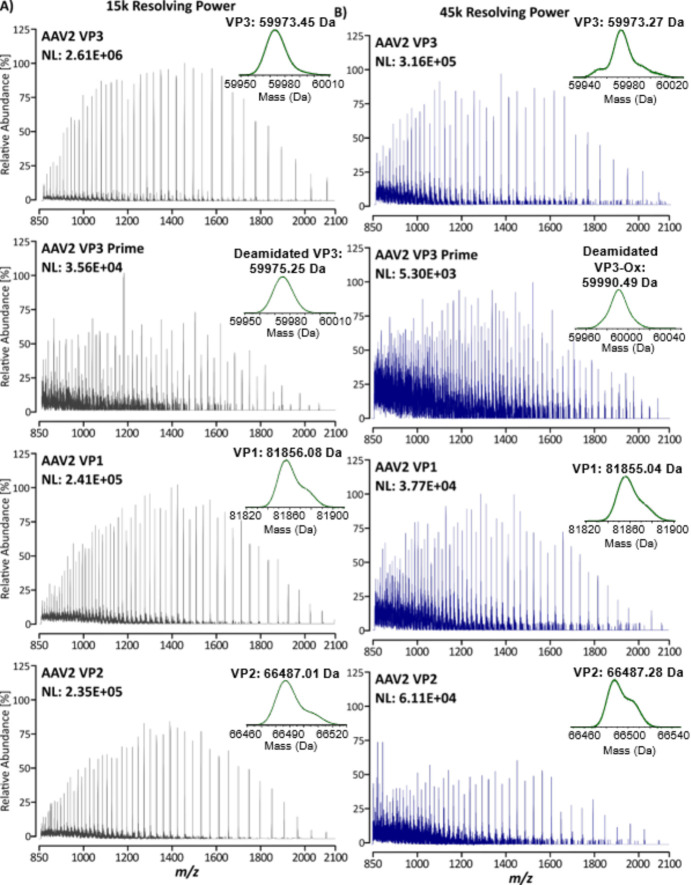
Figure 3.
Raw MS spectra of AAV2 VPs analyzed at 15k resolving power (A) and 45k resolving power (B) illustrating the ability of this platform to generate high-quality MS spectra for full-length VP characterization. Top—VP3; middle top—VP3 prime; middle bottom—VP1; bottom—VP2. Deconvoluted MS spectra of the most abundant proteoform identified for each VP are shown above each spectrum on the upper right.

