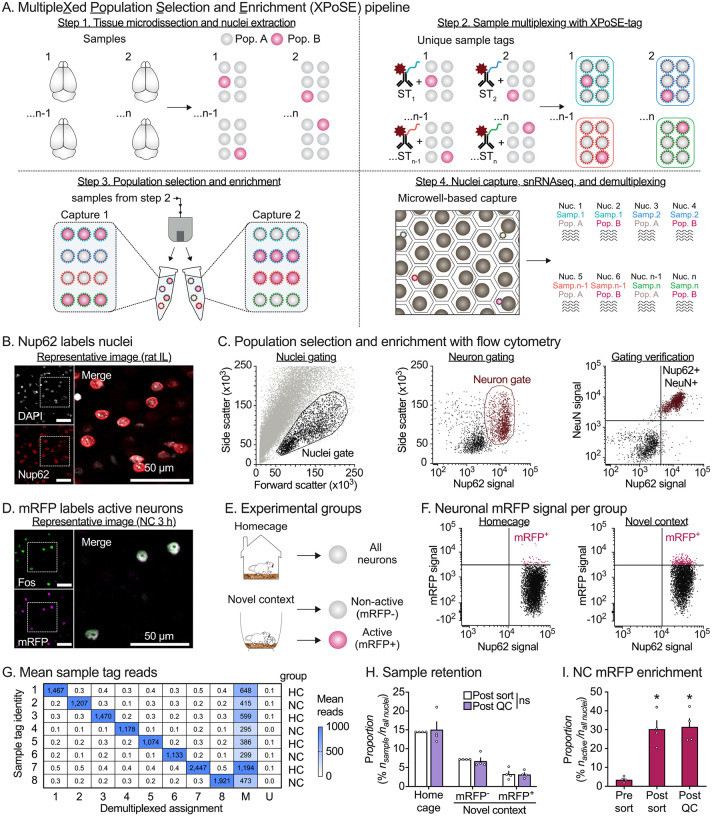
Figure 1: Development of MultipleXed Population Selection and Enrichment single nucleus RNA-sequencing.
A, XPoSE-seq workflow. After tissue microdissection and nuclei isolation, nuclei from individual samples are incubated with a R718 dye- and oligo-conjugated nucleoporin antibody (XPoSE-tag). Specific populations are enriched by gating for the XPoSE-tag and other population-labeling markers with flow cytometry. Sorted nuclei containing known proportions of each sample/population are captured in a cartridge-based system (BD Rhapsody). B, Representative immunofluorescent (IF) image of rat IL shows successful nuclei (DAPI-labeled, white) co-labeling with nucleoporin (red). Scale bar = 50 μm. C, Event scatter plots from nuclear preps demonstrate dual-conjugated Nup62 is detected with flow cytometry. Nuclei are gated from debris based on forward- and side-scatter properties (left). Neuronal populations are selected by nucleoporin signal (middle). Neurons comprise the right nucleoporin positive population as verified by co-staining for the neuronal nuclei marker, NeuN (right). D, Representative IF image of rat IL shows that mRFP is expressed in cells expressing Fos in Fos-mRFP transgenic rats. E, Experimental design (left), Fos-mRFP transgenic rats explored a novel context for one hour or remained in the homecage. All neurons were collected in Homecage samples, and Active (mRFP+) and Non-active (mRFP−) neuronal nuclei were collected from novel context samples. F, Gating strategy to enrich for behaviorally active neurons. The mRFP-positive threshold is determined by comparing mRFP signal between neurons from Novel context and Homecage preps. G, Demultiplexed assignment matches to presence of corresponding Sample tag identity reads. H, Sample proportion between sorted and Post-QC total nuclei was not affected by multiplexing, regardless of population size. Data is expressed as the mean percent ± S.E.M. of each rat/population combination in the dataset. ns indicates no difference (p > 0.9999) between the percent collected and retained from each rat (n = 4 per group). I, The mean percentage ± S.E.M. of mRFP in the neuron population is enriched from the original sample by sorting and is retained in the dataset after QC. * Significant difference from original sample (n = 4 per group). See Table S1 for detailed listing of all statistical outputs.

