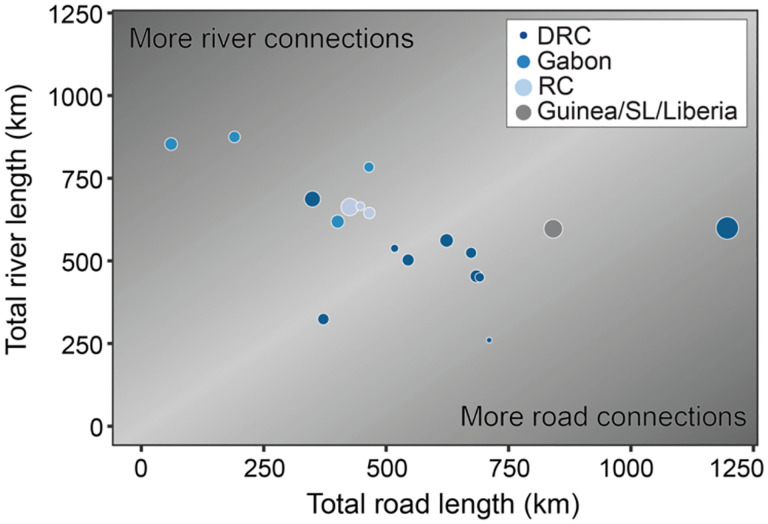
Figure 2.
Total road and river network lengths for each spillover event at the time of the spillover event in a 150×150 study area surrounding the spillover. The 1:1 line is shaded in the lightest gray in the background, size of points corresponds to number of cases in the first 100 days of each outbreak, and color corresponds to location of spillover.

