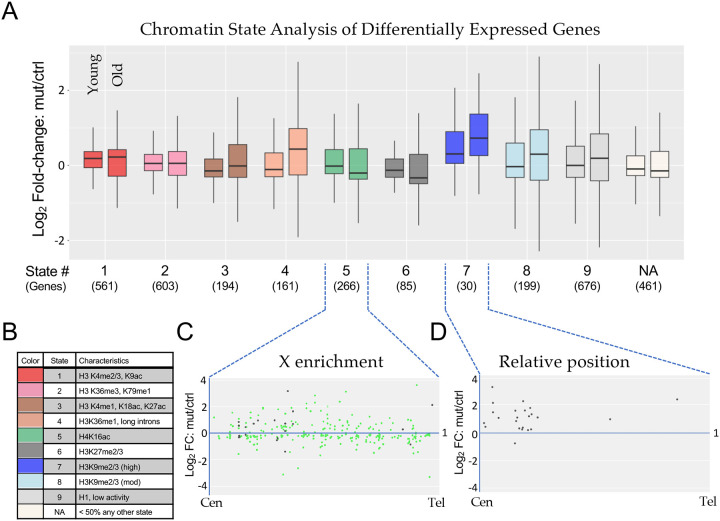
Figure 5. Chromatin state analysis of differentially expressed genes.
(A) The combined set of differentially expressed genes (adjusted p-value < 0.05) from the non-interaction DESeq2 model for both Young and Old conditions for H3.3K36R mutants relative to H3.3Anull controls was binned by predominant chromatin state [38]. Genes were binned to a given state if > 50% of the gene was marked by that state. The “NA” category was comprised of genes where no state color was > 50% of gene length (406 genes) or if chromatin states were undetermined when the original chromatin state study was published (55 genes). The mut/ctrl Log2 fold-change value for binned genes was plotted separately for Young and Old conditions. (B) A legend for colors corresponding to each chromatin state depicted in panel A, with representative histone marks for each state. (C and D) For genes in States 5 and 7, mut/ctrl Log2 fold-change values for the Old condition were plotted versus relative position along chromosome arms for all chromosomes, from centromere (Cen) to telomere (Tel). For State 5, the X chromosome genes are colored green, and autosomal genes, black.

