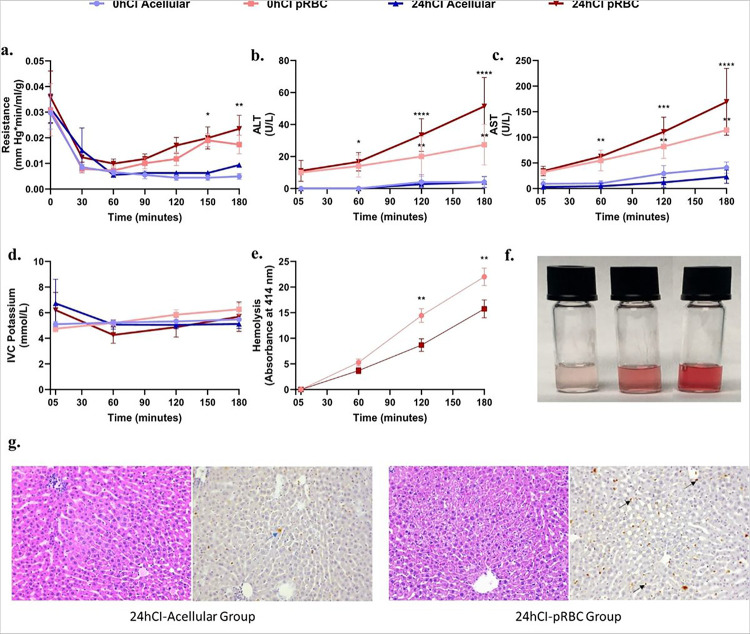
Figure 3. Portal vein pressure, ALT, and AST levels indicate higher injury to livers perfused with packed RBCs compared to acellular perfusate for the 3 hours of perfusion.
a, Shows the trends in resistance for the tested conditions. It is significantly higher in the pRBC groups than the acellular perfusate groups after 2 hours of perfusion. There is no significant difference between the fresh and cold storage groups for each type of perfusate. b,c, Show trends in ALT and AST levels between the four groups, where pRBC perfusate groups show higher values compared to the acellular perfusate groups. The statistically significant difference becomes more prominent over time for these groups. d,Shows no significant difference in IVC potassium for all four groups during perfusion. e, Shows hemolysis over the duration of perfusion. There is no significant difference at any time during the perfusion between 0hCI and 24hCI groups. The hemolysis is also evident from the increasing red coloration of the perfusate samples with time as shown in f. Finally, g, shows representative histology to show the patters of injury in 24hCI livers from acellular and pRBC groups stained with H&E and TUNEL stains (Magnification 20x). The blue arrows indicate hepatocyte death while the black arrows show endothelial death as observed via TUNEL staining of apoptotic cells. Statistical significance levels - * p<0.033, ** p<0.0021, *** p<0.0002, **** p<0.0001.

