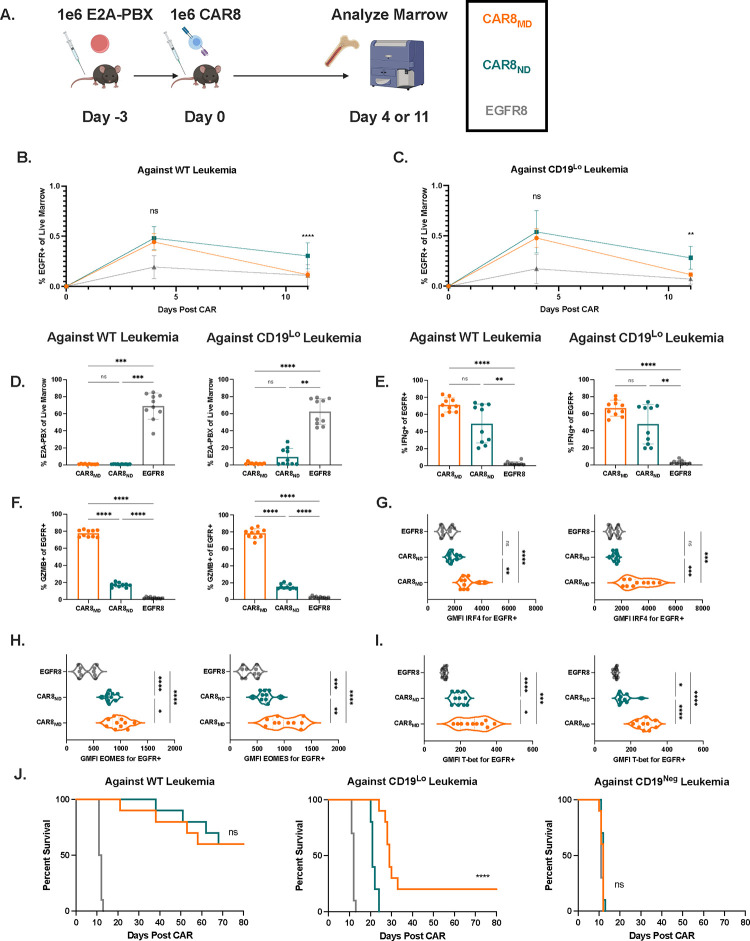
Figure 2: CAR8MD exhibit enhanced cytotoxicity and clearance of CD19Lo leukemia in vivo (high CAR dose).
2A: Schematic: Timeline for in vivo experiments. Rag1−/− mice were injected with 1e6 E2A-PBX1 leukemia on day −3, followed by 1e6 OT-I CD8+/EGFR+ T cells from indicated T cell condition on day 0. Bone marrow was analyzed by flow cytometry on day +4 or day +11. T cell populations were isolated memory-derived CAR T cells (CAR8MD), isolated naïve-derived CAR T cells (CAR8ND) or EGFR control T cells (EGFR8). Leukemia populations were CD19Neg, CD19Lo(10,000 antigens/cell), or WT (35,000 antigens/cell). 2B-C: Early T cell expansion (day +4) or persistence (day +11) after infusion of transduced T cells against WT leukemia (B) and CD19Lo leukemia (C). Transduced T cell populations measured by coexpression of CD8a+/TCRbeta+/EGFR+. 2D: Clearance of WT and CD19Lo leukemia at day +11 after CAR infusion. E2A-PBX measured by coexpression of B220+/CD22+. 2E-F: Intracellular cytokine staining of interferon gamma (E) or granzyme B (F) in CAR T cells from whole bone marrow restimulated ex vivo with leukemia. Data represent mean +/− SD. 2G-I: Intranuclear transcription factor staining of IRF4 (G), EOMES (H), or T-bet (I) on CAR+ T cells from mice bearing the indicated leukemia at day +4 after CAR infusion. Violin plot data represent median with quartiles. Data are from 2 pooled, independent experiments with n=10 mice per condition. * p<0.05, ** p<0.01, *** p<0.001, **** p<0.0001. 2J: Survival of mice after treatment with 1e6 EGFR+ CAR or control T cells. Survival statistics were performed using log-rank (Mantel-Cox) test * p<0.05, ** p<0.01, *** p<0.001, **** p<0.0001. Data is from 2 independent pooled experiments, total n=10 mice per group.

