
Figure 3. Crystal structure of ZIKV-specific EDE antibody rhMZ107-B in complex with ZIKV E glycoprotein.
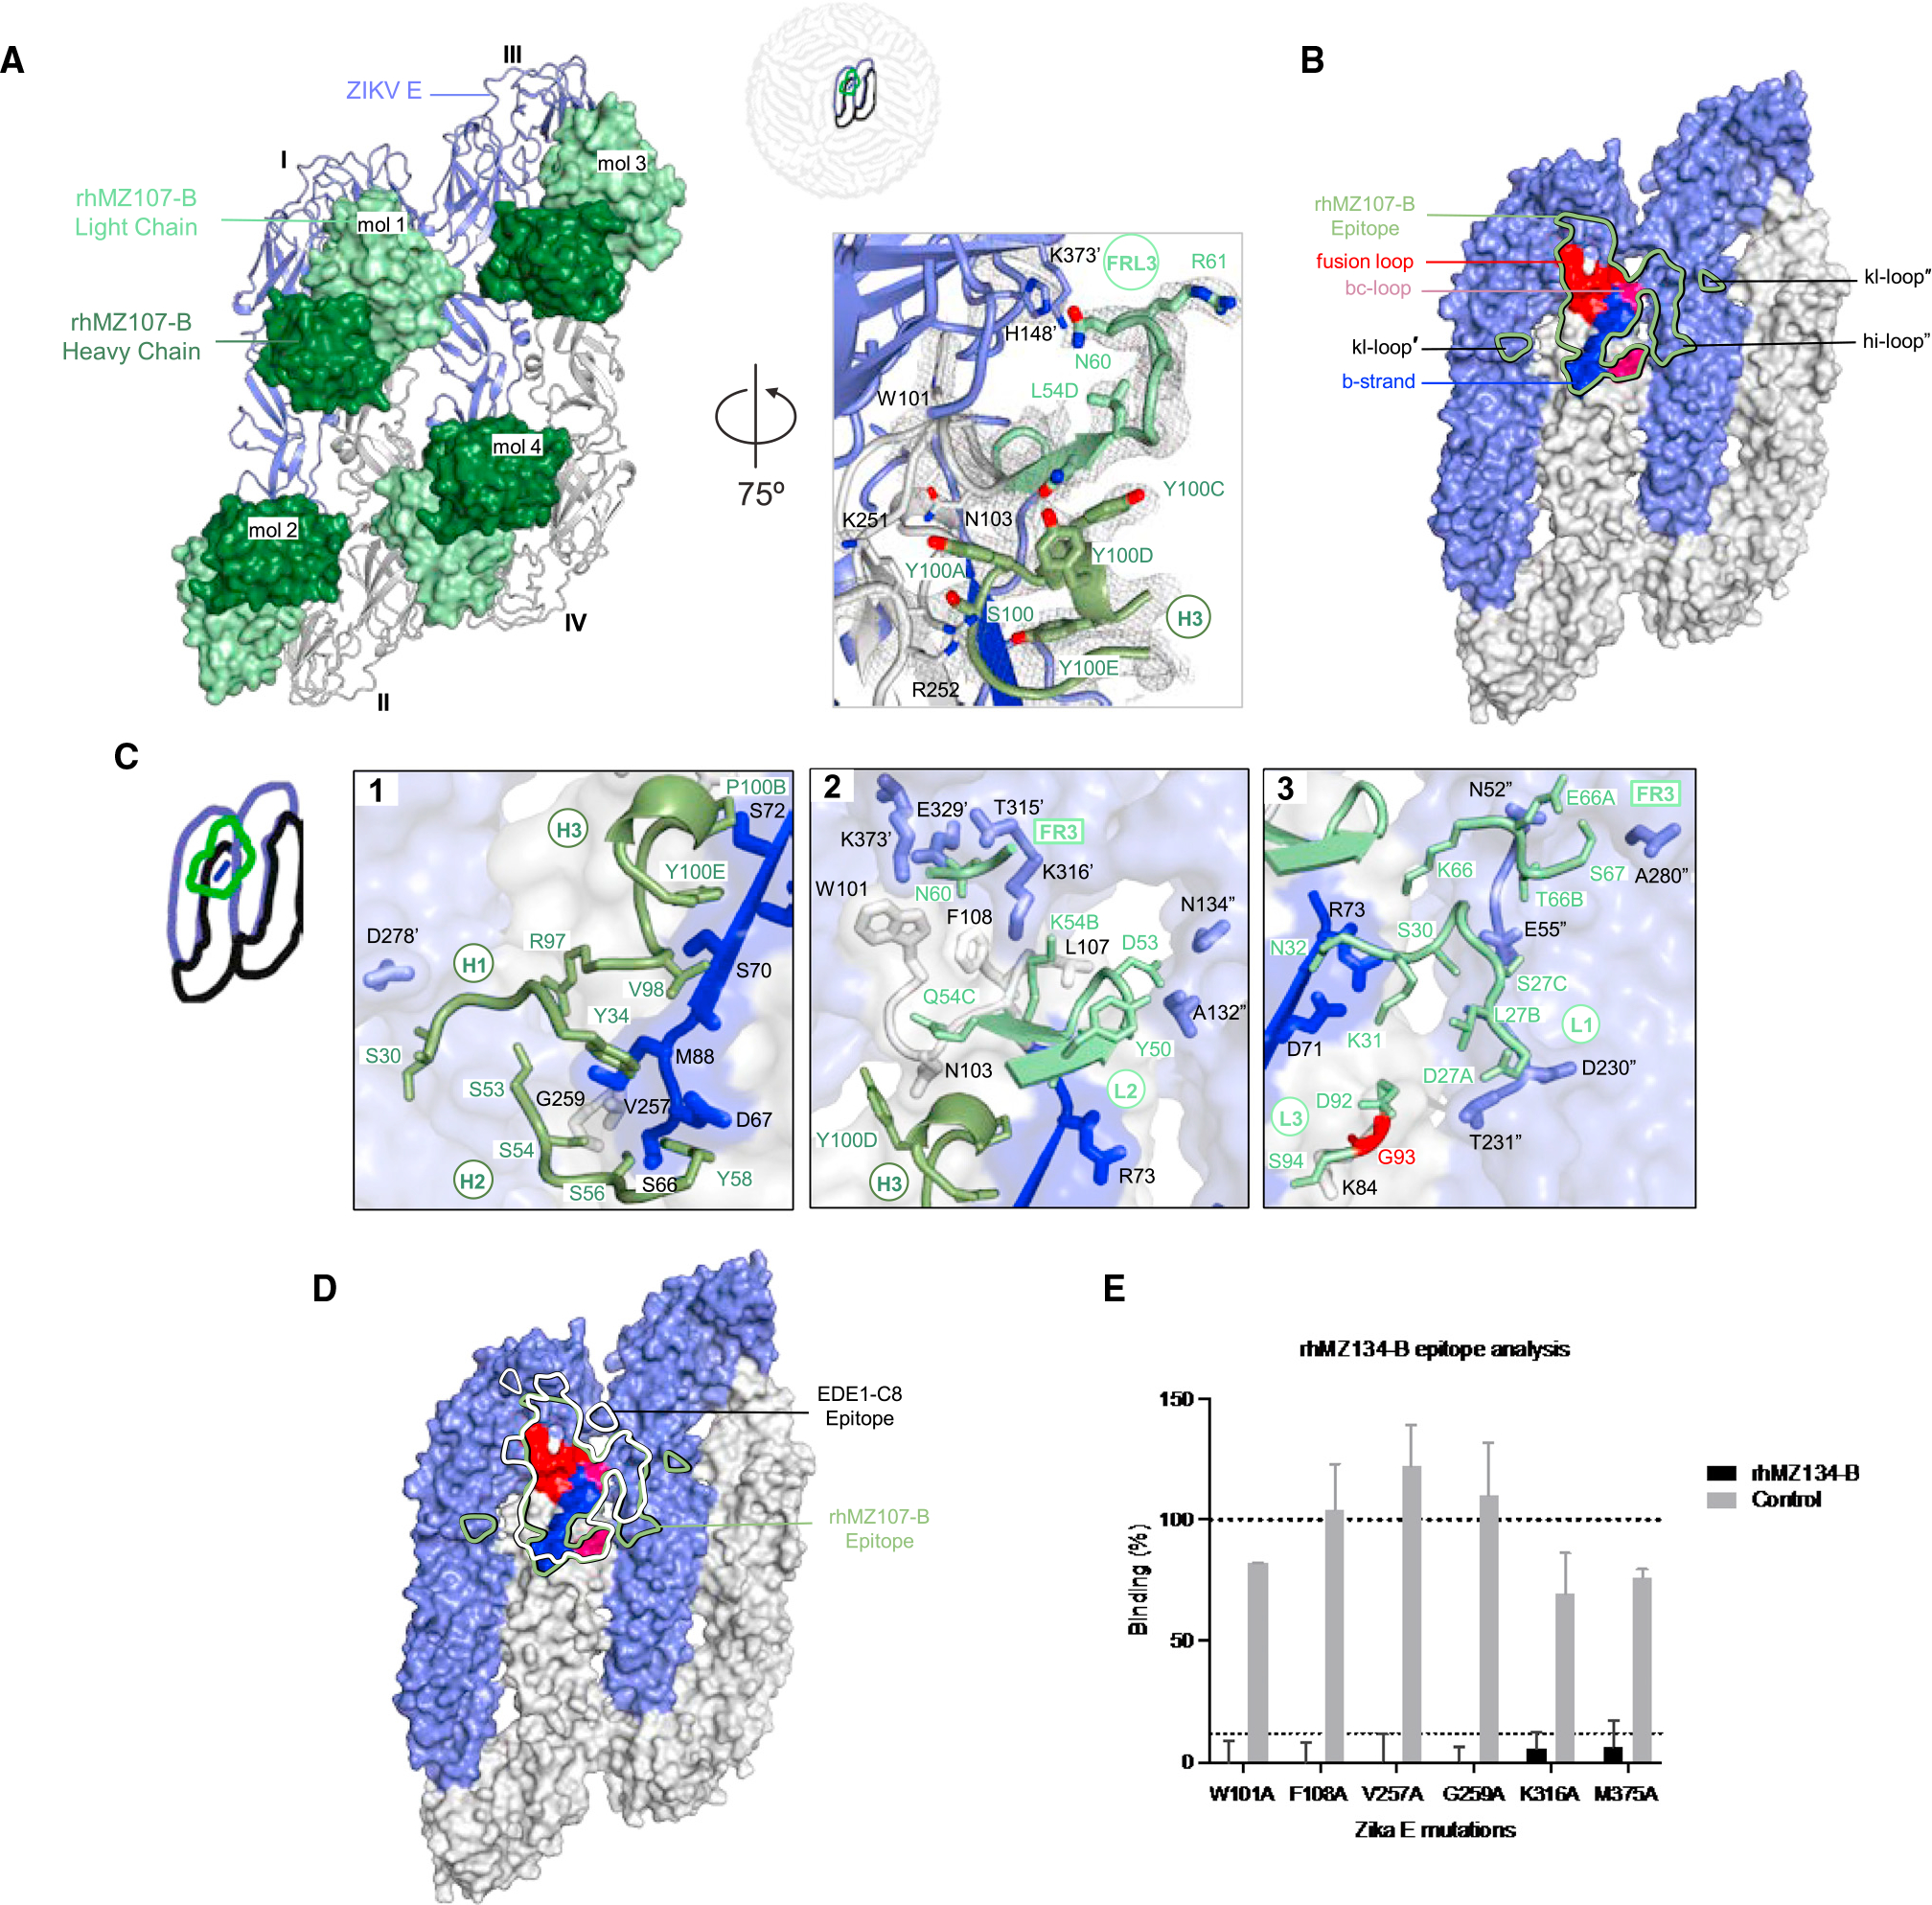
(A) Left: top view of the co-crystal structure of rhMZ107-B in complex with ZIKV E (PRABC59). rhMZ107-B Fv heavy and light chains are shown in surface representation and are colored dark and light green, respectively, while four ZIKV E protomers are shown in ribbon representation and colored blue and gray. Four ZIKV E protomers, left to right, are labeled as I–IV. Right: 2Fo-Fc electron density for the rhMZ107-B (mol 1) and ZIKV E interface residues is shown as gray mesh (contoured at 1.5σ).
(B) Epitope footprint of rhMZ107-B antibody (mol 1) is shown as solid green line, displayed on four ZIKV E protomers shown in surface representation. TherhMZ107-B epitope extends across protomers I–III. Relevant antigenic ZIKV E regions within the epitope are labeled (fusion loop is in red, b strand in blue, bc-loop in magenta, and other loop regions are labeled). Antigenic regions of protomers I and III are marked with prime (′) and double prime (″), respectively.
(C) rhMZ107-B contact residues are shown as sticks based on (1) CDRs H1, H2, and H3; (2) CDR H3 and L2; (3) CDR L1, L3, and FR L3 antibody-contacting regions. ZIKV E contact residues of protomers I and III are marked with prime (′) and double prime (″), respectively. The b strand residues 63–73 on protomer II are colored dark blue. mAb somatic hypermutation (SHM) residues are colored bright red.
(D) Epitopes for rhMZ107-B and EDE1-C8 are represented with green and white lines, respectively. EDE1-C8 (PDB: 5LBS) antibody was overlaid onto therhMZ107-B ZIKV E structure to map the epitopes.
(E) Shotgun mutagenesis ZIKV E epitope analysis for rhMZ134-B antibody. Relative binding to ZIKV prM/E for individual mutations is plotted. Residues from which substitution to alanine causes >90% loss in binding were considered important for binding; limit of detection: 10% (gray dotted line). Error bars indicate mean ± SEM from two independent experiments.
See also Figures S3–S5 and Tables S4 and S5.