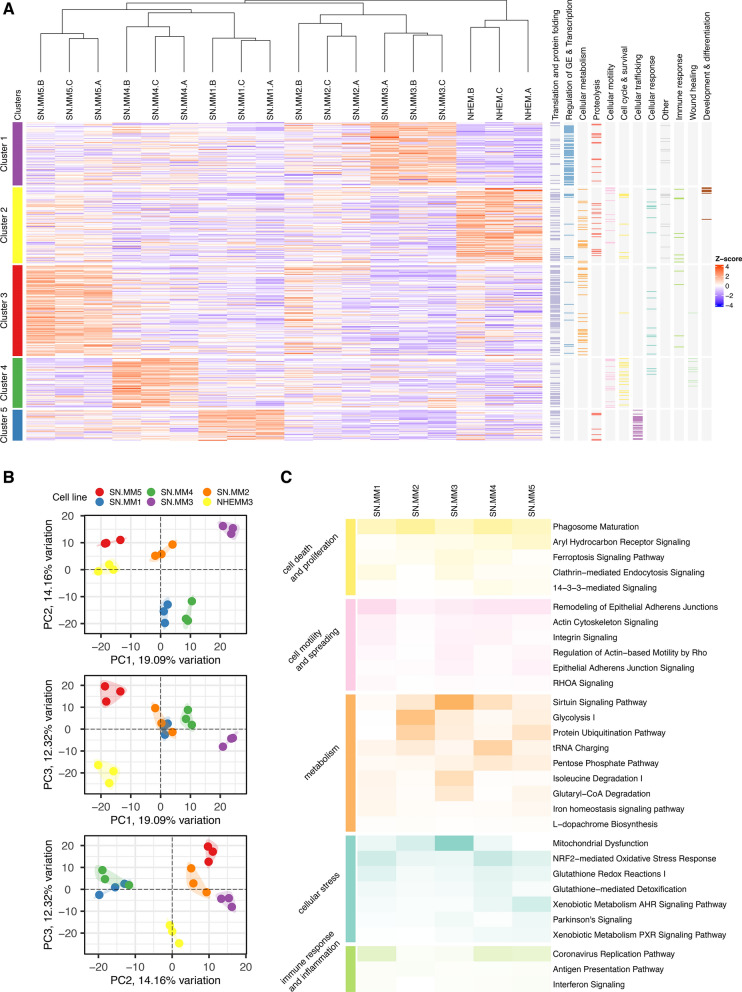
Fig. 7.
Proteomic profile of SN-MM cell lines. A Heatmap showing the expression of proteins involved in the significant up-regulated biological processes (393/1148 quantified, right panel); the five proteins’ clusters are highlighted and each of them is up-regulated in a different SN-MM cell line. B Scatter plots showing the combined projections of the first three components of a principal component analysis (PCA) run considering the whole protein expression on the cell lines’ samples. C Heatmap reporting the significant Canonical Pathways differentially regulated in all SN-MM cell lines versus normal melanocytes cell line (NHEM); color intensity is inversely proportional to p-values

