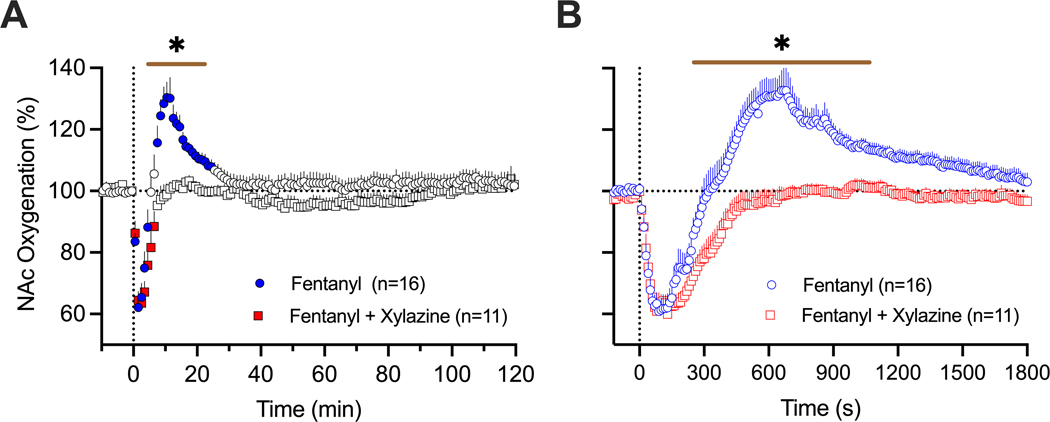
Figure 3.
Mean (±SEM) changes in NAc oxygen levels induced by fentanyl (20 ug/kg) and its mixture with xylazine (20 ug/kg + 1 mg/kg) in freely moving rats. A = mean (±SEM) changes assessed with slow (1-min) time resolution. B = mean (±SEM) changes assessed with rapid (10-s) time resolution. Filled symbols show values significantly different from pre-injection baseline. n = numbers of averaged responses. Bold horizontal lines with asterisk show time intervals, during which between-group values were significant.

