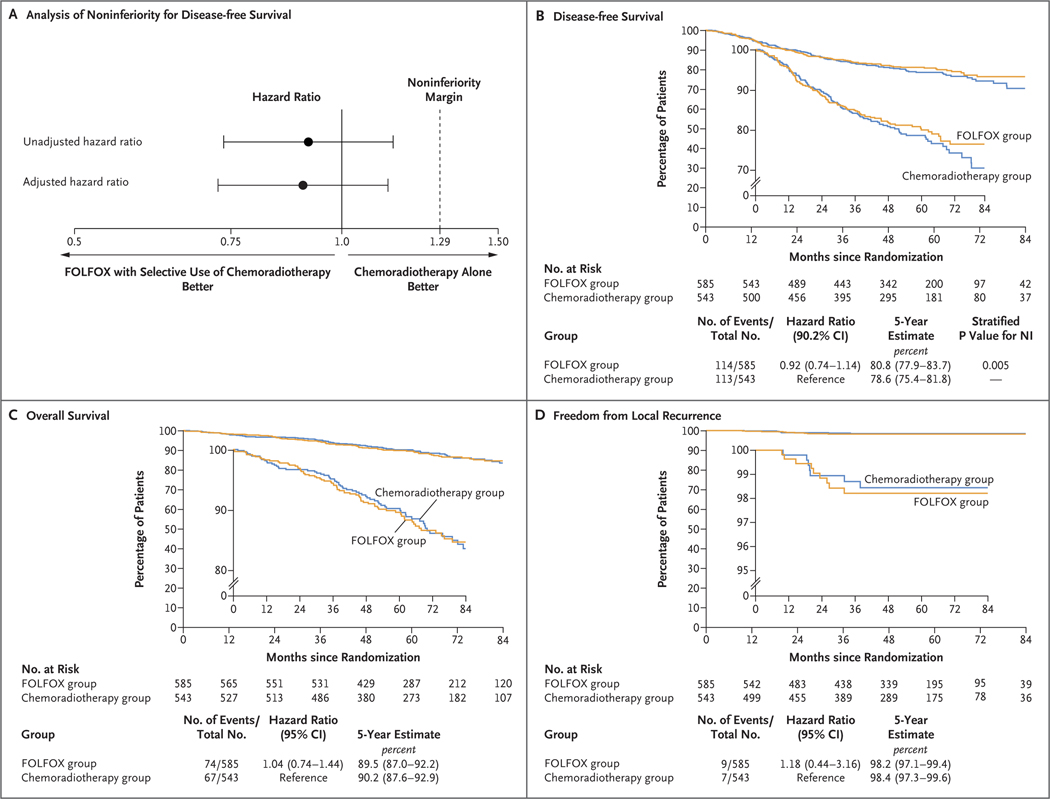
Figure 2. Noninferiority Margin and Kaplan–Meier Curves for Disease-free Survival, Overall Survival, and Freedom from Local Recurrence.
In Panel A, the dashed line at a hazard ratio of 1.29 indicates the noninferiority margin. Values to the left of 1.29 are those for which FOLFOX with selective use of chemoradiotherapy would be considered noninferior to chemoradiotherapy alone with respect to disease-free survival. The adjusted hazard ratio was estimated with a multivariable Cox model with adjustment for age and nodal status (node-positive vs. node-negative). The widths of the confidence intervals in Panels C and D have not been adjusted for multiplicity, and therefore these intervals should not be used to infer definitive treatment effects. NI denotes noninferiority.

