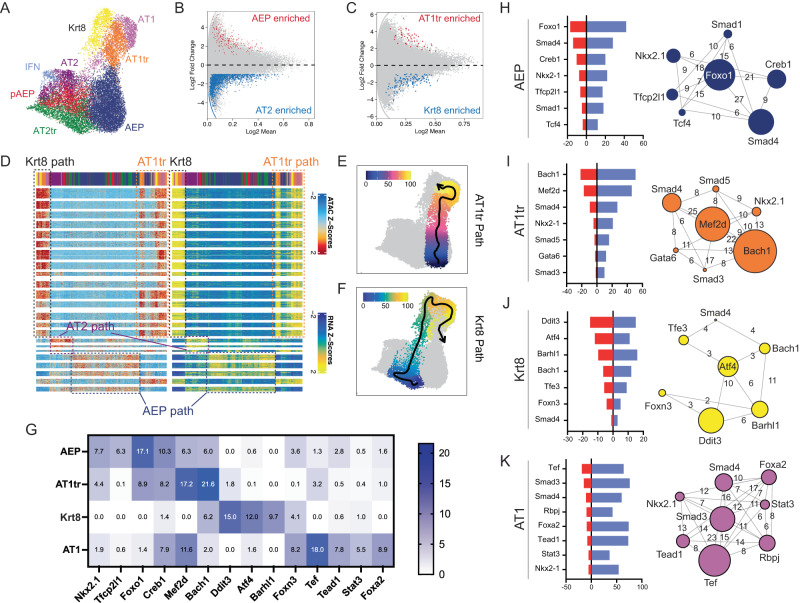
Fig. 4. scATACseq analysis of AEP-derived organoid formation.
A UMAP of cellular populations within organoids, named as in RNAseq integration. B, C Volcano plots showing differential chromatin accessibility regions between AEP and AT2 cells (B) and AT1tr and Krt8+ transitional cells (C). D Paired heatmap of differentially accessible genomic loci in ATAC (left) and RNA expression of nearest-neighbor gene production (right) showing an overview of regulators of AT1 cell differentiation (AT1 path), AT2 cell differentiation (AT2 path), and AEP state (AEP path) derived from integrated analysis. Cell populations shown along top bar, with colors the same as in (A). E, F Pseudotime prediction of separate AT1 differentiation trajectories from AEPs to AT1 cells through AT1tr path (E) and Krt8+ path (F). G Transcriptional activity score (TAS, negative -log two-sided p-value of TF enrichment per cell type by Fisher exact test) for TFs per cell type in AT1 differentiation trajectories. H–K Top transcriptional regulators of AEP (H), AT1tr (I), Krt8+ (J), and AT1 (K) cell states. Red bar = TAS, and blue bar = # of regulated genes expressed in given cell type. Network diagram shows core regulator relationship, with circle size indicating TAS and numbers of bars showing co-regulated gene networks per cell type. Source data are provided within the Source Data file.

