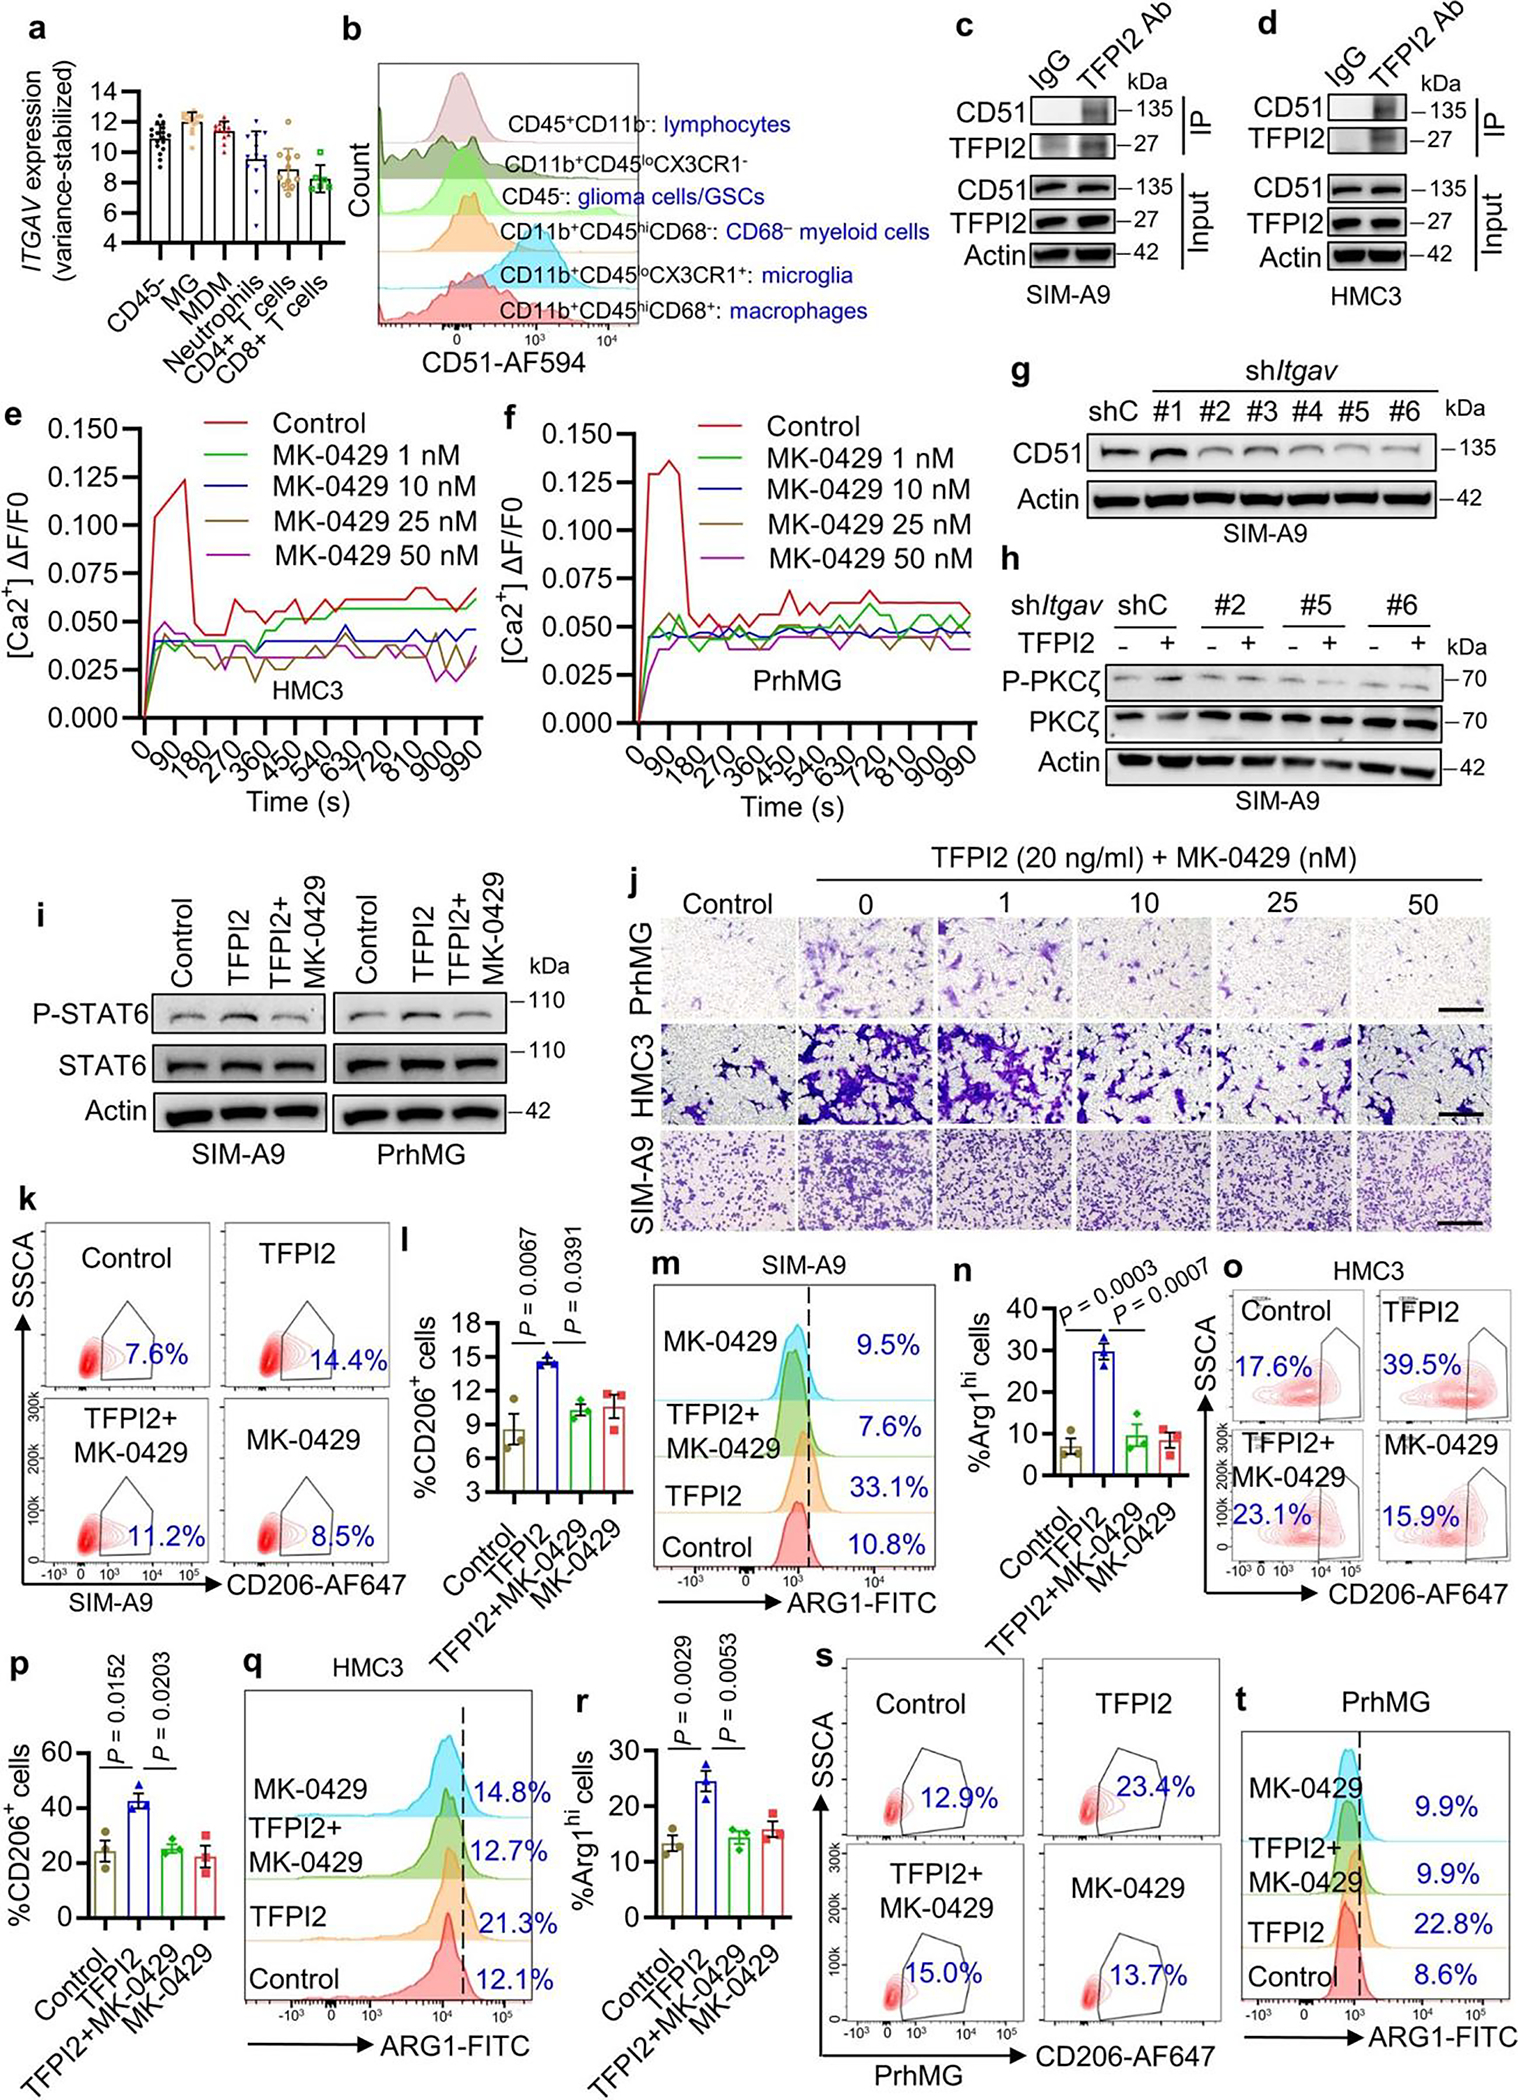
Extended Data Fig. 6. CD51 is a receptor for TFPI2 activities on microglia.

a, CD51 expression level in human GBM samples from the TIME dataset. n = 17, 15, 13, 13, 11, and 6 for CD45− cells, microglia (MG), macrophages (MDM), neutrophils, CD4+ T cells and CD8+ T cells, respectively. b, CD51 expression in different cell populations in mouse CT2A tumor tissues. c, d, Immunoprecipitation with TFPI2 antibody (TFPI2 Ab) and immunoblotting for the interaction between TFPI2 and CD51 in SIM-A9 (c) and HMC3 (d) microglia. e, f, Calcium mobilization triggered by TFPI2 protein in HMC3 microglia (e) and PrhMG (f) treated with or without CD51 inhibitor MK-0429 at indicated concentrations. g, Immunoblots for CD51 in cell lysates of SIM-A9 microglia expressing shRNA control (shC) and Itgav shRNAs (shItgav). h, Immunoblots for P-PKCζ and PKCζ in cell lysates of shC and shItgav SIM-A9 microglia treated with or without TFPI2 protein. i, Immunoblots for P-STAT6 and STAT6 in cell lysates from SIM-A9 microglia and PrhMG treated with TFPI2 protein and MK-0429. j, Representative of transwell migration of PrhMG human HMC3, and mouse SIM-A9 microglia treated with or without TFPI2 protein and MK-0429 at indicated concentrations. Scale bars, 200 μm for HMC3 and SIM-A9, and 400 μm for PrhMG. k–n, Representative and quantification of flow cytometry for the percentage of CD206+ (k,l) and ARG1+ (m,n) SIM-A9 microglia treated with or without TFPI2 protein and MK-0429. n = 3 biological replicates. o–r, Representative (o) and quantification (p) of flow cytometry for the percentage of CD206+ (o,p) and ARG1+ (q,r) HMC3 microglia treated with or without TFPI2 recombinant protein and MK-0429 (50 nM). n = 3 biological replicates. s, t, Representative of flow cytometry for the percentage of CD206+ (s) and ARG1+ (t) PrhMG treated with or without TFPI2 protein and MK-0429. TFPI2 protein at 20 ng/ml and MK-0429 at 50 nM were used unless indicated. Error bars indicate mean ± SEM. One-way ANOVA test.
