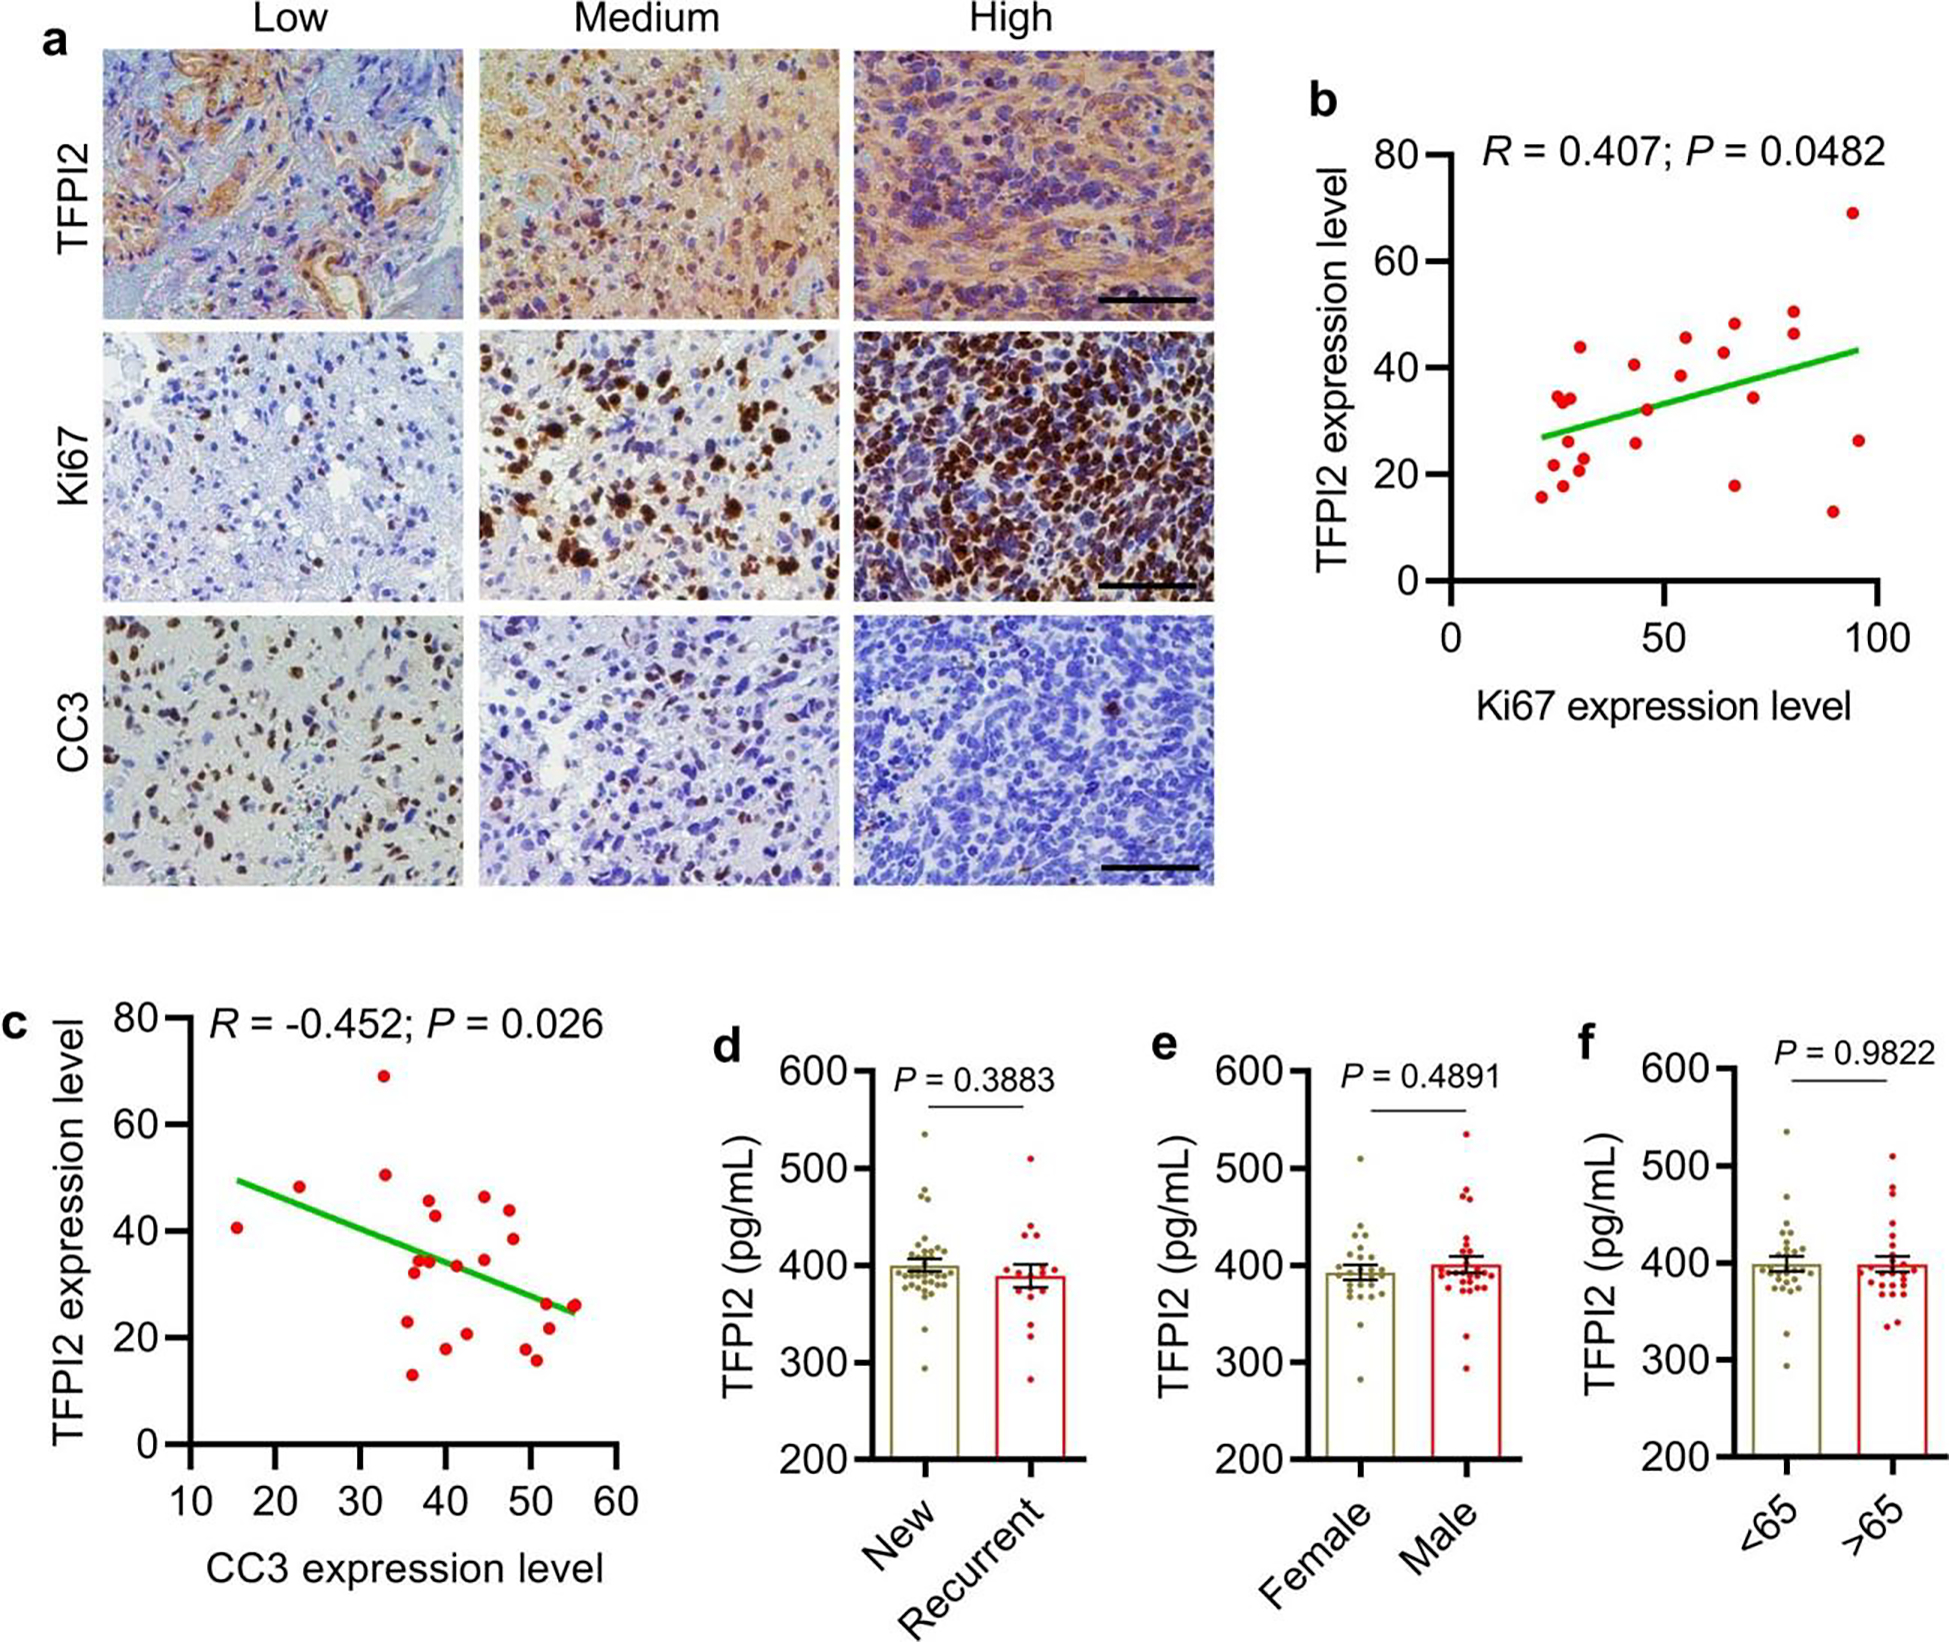
Extended Data Fig. 9. TFPI2 correlates with proliferation and apoptosis markers in GBM patient tumors.

a, Representative images show low, medium, and high expression of TFPI2, Ki67, and cleaved caspase 3 (CC3) in human GBM tumor samples based on immunohistochemistry staining. Scale bar, 100 μm. b,c, Quantification of immunohistochemistry staining showing strong positive correlation between TFPI2 and Ki67 (b) and negative correlation between TFPI2 and CC3 (c) in human GBM tumor samples (n = 24). R and P values were determined by Pearson correlation. d-f, The plasma TFPI2 level in newly diagnosed (n = 38) and recurrent (n = 17) (d), female (n = 26) and male (n = 29) (e), as well as old (>65) (n = 29) and young (<65) (n = 26) GBM patients (f). Error bars indicate mean ± SEM. Student’s t-test.
