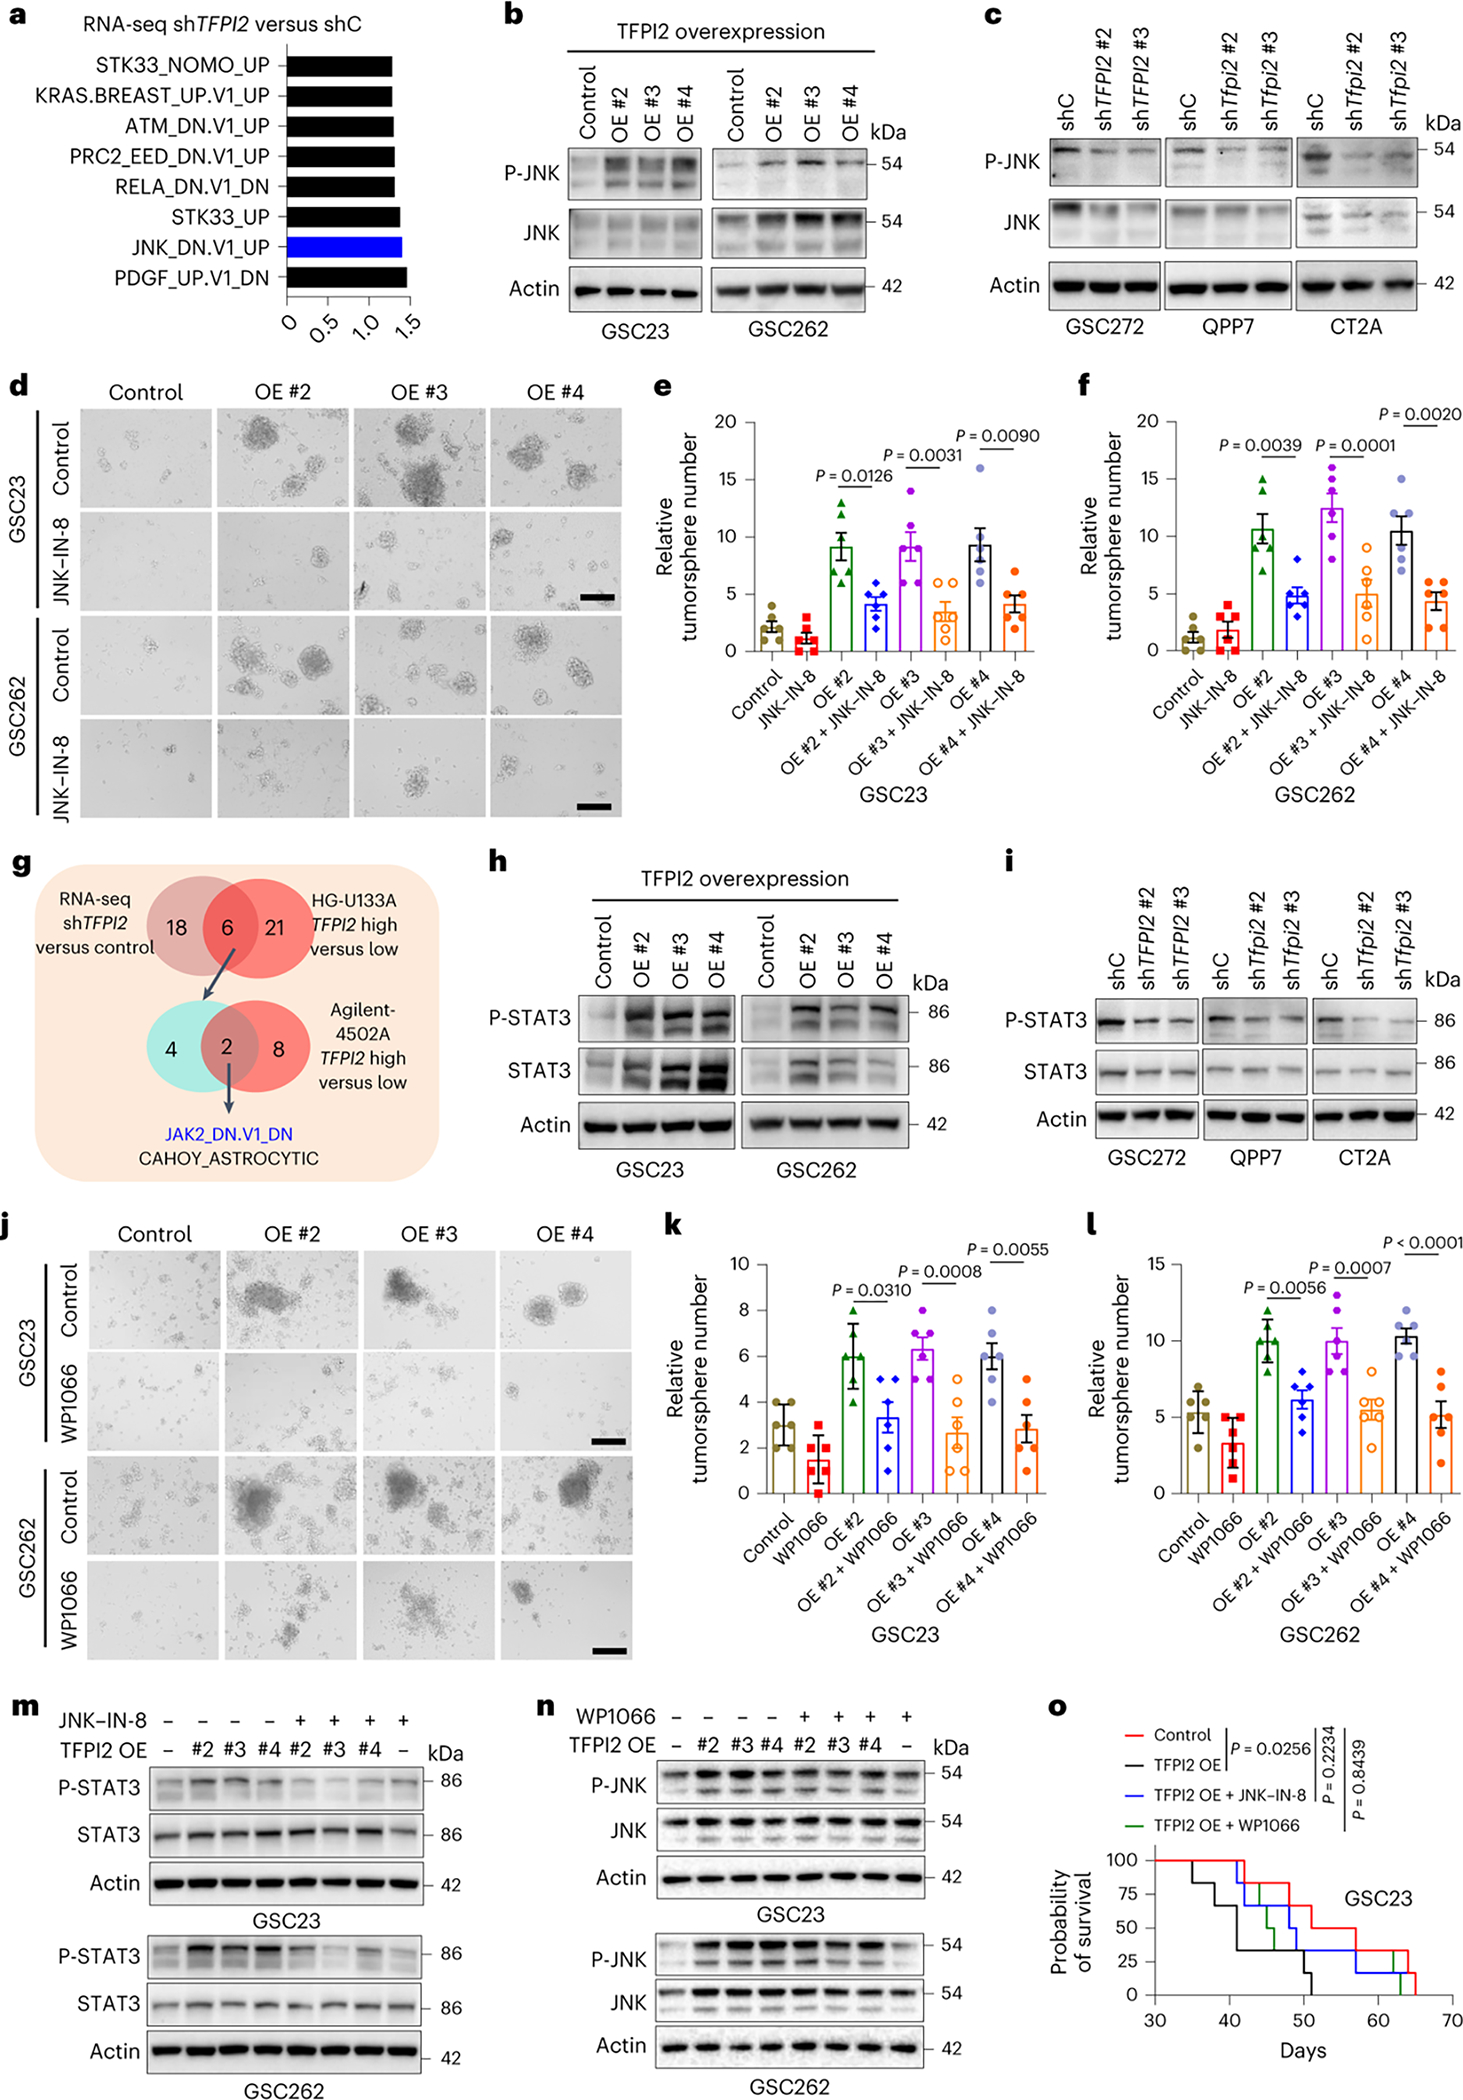
Fig. 3: TFPI2 promotes stemness and tumor growth by activating JNK–STAT3 signaling.

a, Transcriptomic profiling in GSC272 cells following TFPI2 depletion and GSEA analysis shows the eight oncogenic pathways affected by TFPI2 depletion. b, Immunoblots for P-JNK and JNK in GSC23 and GSC262 cells expressing control and TFPI2 overexpression (OE) plasmid. c, Immunoblots for P-JNK and JNK in GSC272, QPP7 GSCs and CT2A cells expressing shRNA control (shC) and TFPI2 shRNAs (shTFPI2). d, Representative images of tumorspheres in GSC23 and GSC262 expressing control and TFPI2 OE plasmid treated with or without JNK inhibitor JNK-IN-8 (10 nM). Scale bar, 400 μm. e,f, Quantification of tumorspheres in GSC23 (e) and GSC262 (f) expressing control and TFPI2 OE plasmid treated with or without JNK-IN-8 (10 nM). n = 6 biological replicates. g, Identification of two oncogenic pathways (as indicated) in distinct datasets with three comparisons (GSC272 RNA-seq data: shC versus shTFPI2 and two TCGA GBM datasets: TFPI2-high versus TFPI2-low). h, Immunoblots for P-STAT3 and STAT3 in GSC23 and GSC262 expressing control and TFPI2 OE plasmid. i, Immunoblots for P-STAT3 and STAT3 in GSC272, QPP7 GSCs and CT2A cells expressing shC and shTFPI2. j, Representative images of tumorspheres in GSC23 and GSC262 expressing control and TFPI2 OE plasmid treated with or without STAT3 inhibitor WP1066 (20 nM). Scale bar, 400 μm. k,l, Quantification of tumorspheres in GSC23 (k) and GSC262 (l) expressing control and TFPI2 OE plasmid treated with or without WP1066 (20 nM). n = 6 biological replicates. m, Immunoblots for P-STAT3 and STAT3 in GSC23 and GSC262 expressing control and TFPI2 OE plasmid treated with or without JNK inhibitor JNK-IN-8 (10 nM). n, Immunoblots for P-JNK and JNK in GSC23 and GSC262 expressing control and TFPI2 OE plasmid treated with or without STAT3 inhibitor WP1066 (20 nM). o, Survival curves of nude mice implanted with 2 × 10⁴ GSC23 expressing control and TFPI2 overexpression (OE) plasmid. Mice were treated with JNK inhibitor JNK-IN-8 (30 mg kg−1 body weight, i.p., every day) or STAT3 inhibitor WP1066 (30 mg kg−1 body weight, i.p., every day) on day 7. n = 6 biological replicates. Error bars indicate mean ± s.e.m. One-way ANOVA test. In o, log-rank test was carried out.
