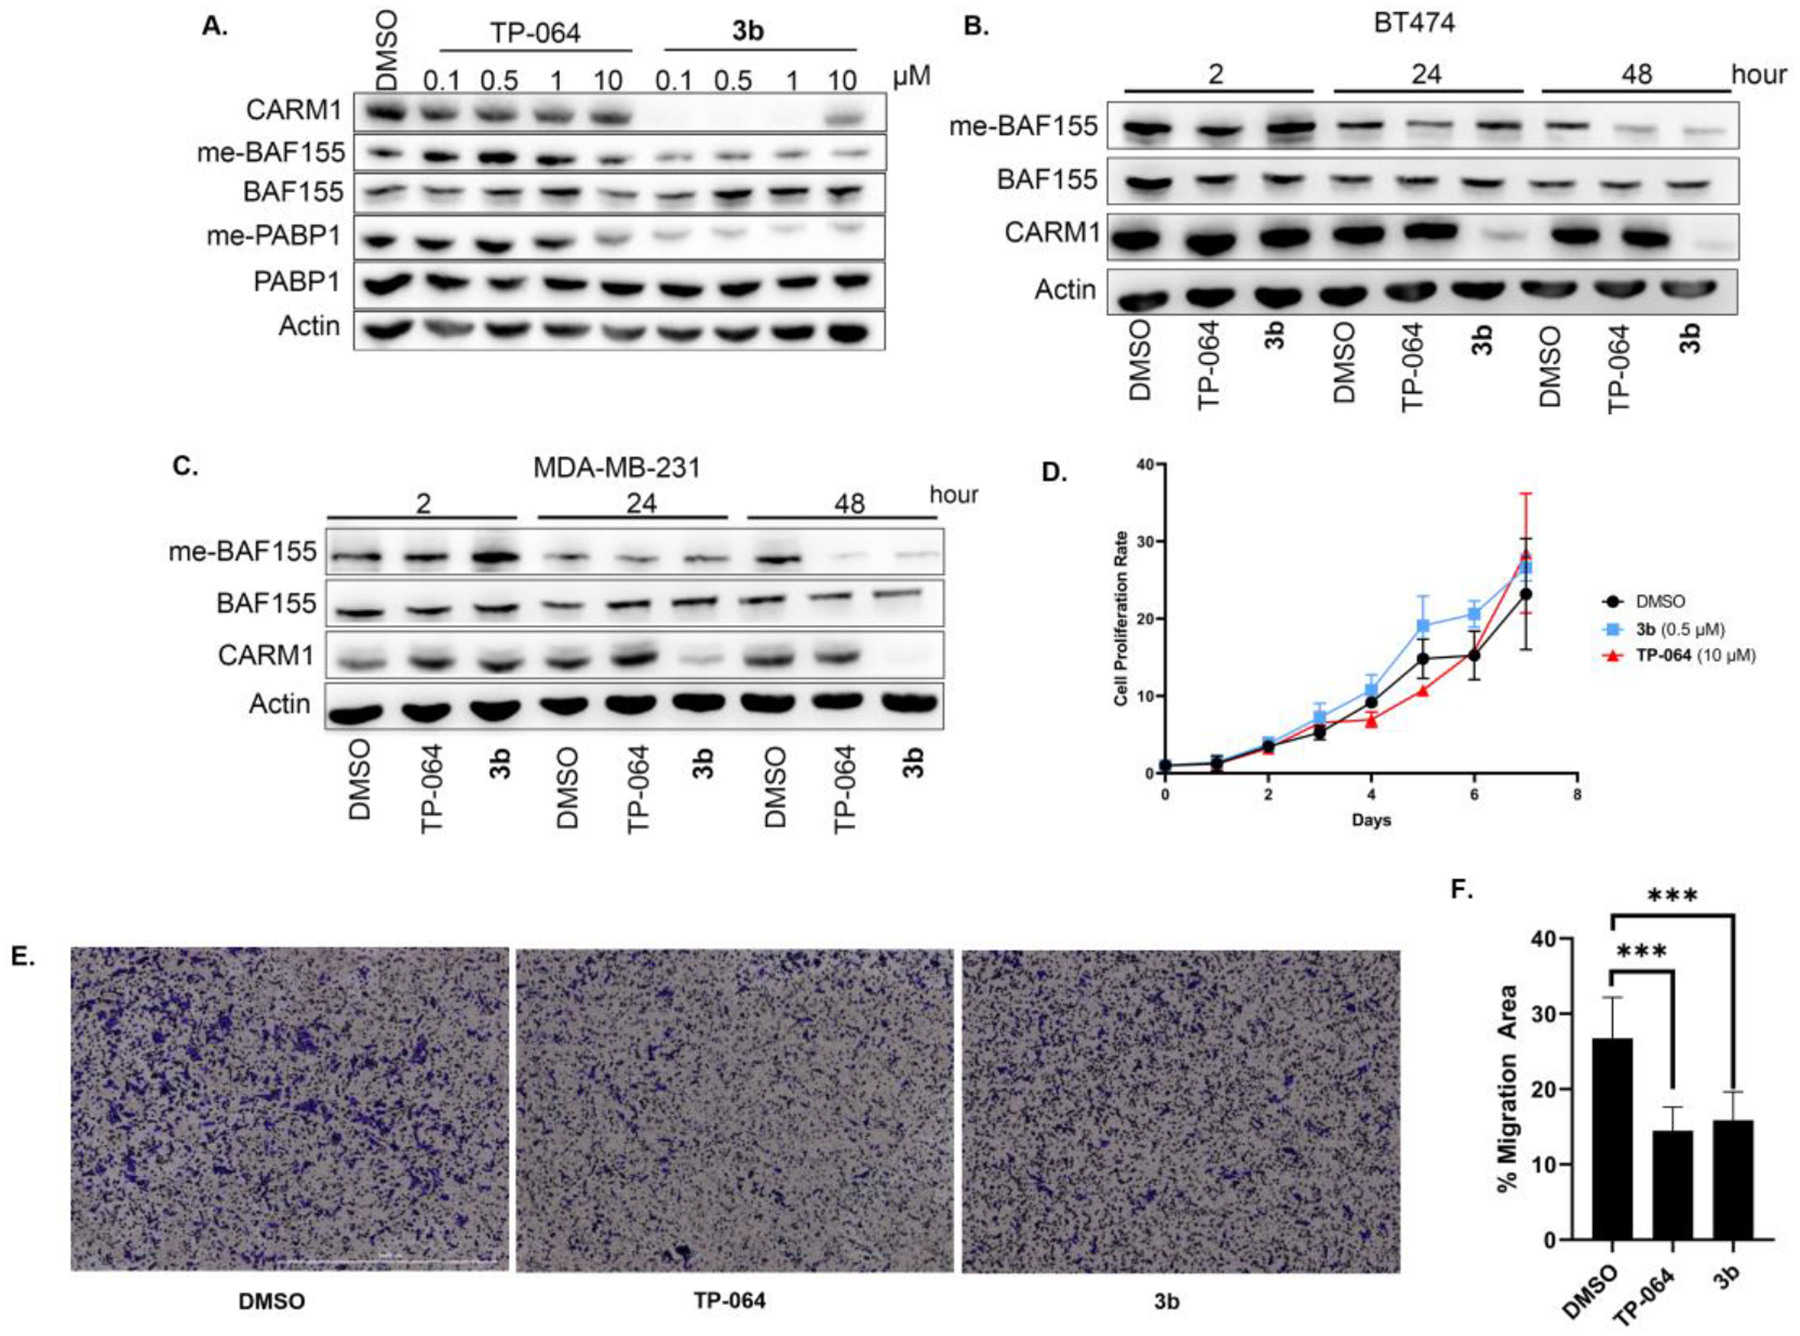
Figure 5.

Biological effect comparison of inhibitor and degrader 3b in cell lines. (A) MCF7 cells were treated with indicated concentrations of TP-064 or 3b for 24 h. Cell lysates were collected and CARM1, methyl-BAF155, total BAF155, methyl-PABP1, and total PABP1 levels were detected by Western blot. (B) BT474 and (C) MDA-MB-231 cells were treated with DMSO, 10 μM of TP-064, and 0.5 μM of 3b for the indicated times. Cell lysates were collected and CARM1, methyl-BAF155, total BAF155 levels were detected by Western blot. (D) MDA-MB-231 cells were treated with DMSO, 0.5 μM of 3b, or 10 μM of TP-064 for 7 days. Cell proliferation rate normalized to day 0 was plotted. (E) and (F) Transwell cell migration assays after MDA-MB-231 cells were treated with DMSO, 0.5 μM 3b, or 10 μM TP-064. Migrated cells were stained with 1% crystal violet and the percentage of migrated cells were plotted. Data mean ± s.d. ***. P ≤ 0.001.
