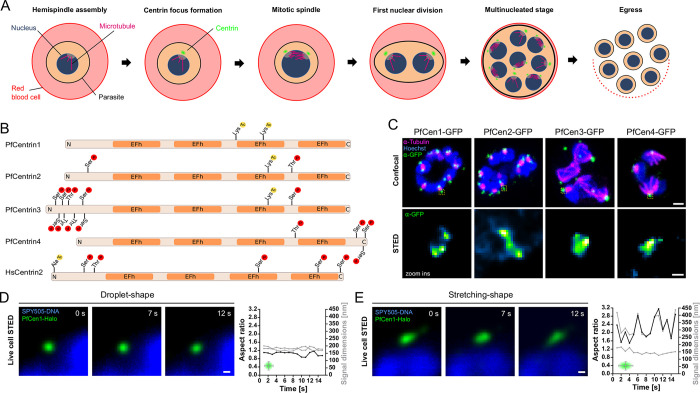
Fig 1. PfCen1-4 localize to centriolar plaque and can display liquid-like dynamics.
(A) Schematic of nuclear and cell division during asexual blood stage schizogony (B) Schematic of PfCen1-4 and HsCen2 indicating reported post-translational modifications and EFh domains. (C) Immunofluorescence staining of tubulin and PfCen1-4-GFP in parasite strains. All images are maximum intensity projections (MIP). DNA stained with Hoechst. Scale bars; confocal, 1 μm, STED, 100 nm. (D-E) STED time lapse of centriolar plaque region of parasites expressing PfCen1-Halo labeled with MaP-SiR-Halo dye. DNA stained with SPY505-DNA. Scale bar, 100 nm. Quantification of ratio (black line) between height and width (grey lines) of the PfCen1-Halo signal, as indicated in the small schematic.

