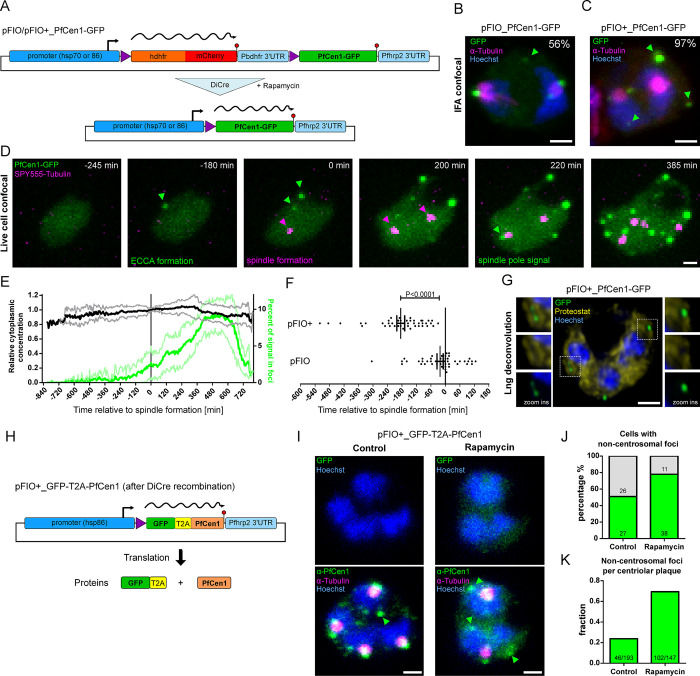
Fig 5. PfCen1 displays condensate-like properties in parasites.
(A) Schematic of pFIO plasmids during DiCre-dependent recombination. (B) Immunofluorescence of tubulin and GFP in parasites moderately overexpressing PfCen1-GFP (pFIO). Percentage of early schizonts containing ECCAs (arrows) indicated. (C) as in (B) but for cell strongly overexpressing PfCen1-GFP (pFIO+) (D) Time lapse images of parasites overexpressing PfCen1-GFP from pFIO+ and labeled with microtubule live stain SPY555-Tubulin (E) Normalized mean cytoplasmic PfCen1-GFP fluorescence intensity over time and share of PfCen1-GFP fluorescence signal contained within foci with standard deviation. n > 33. (F) Quantification of timepoint of PfCen1-GFP foci appearance relative to first mitotic spindle formation detected by SPY650-tubulin comparing pFIO/pFIO+; standard error of the mean, two-tailed t-test, n1 = 46, n2 = 45. (G) Proteostat and PfCen1-GFP live cell staining. (H) Schematic of pFIO+ version containing T2A skip peptide and expected translation products. (I) Immunofluorescence of rapamycin-induced and control parasites carrying pFIO+_GFP-T2A-PfCen1 plasmid labelled with anti-PfCen1 and anti-Tubulin antibodies. Arrow heads indicate foci above threshold. All images are MIP. DNA stained with Hoechst. Scale bars; 1 μm. (J) Quantification of cells having non-centrosomal foci (which includes unspecific background dots and ECCAs) in induced (n = 49) and control (n = 53) conditions. Absolute numbers given in columns. (K) Quantification of number of non-centrosomal foci per centriolar plaque.

