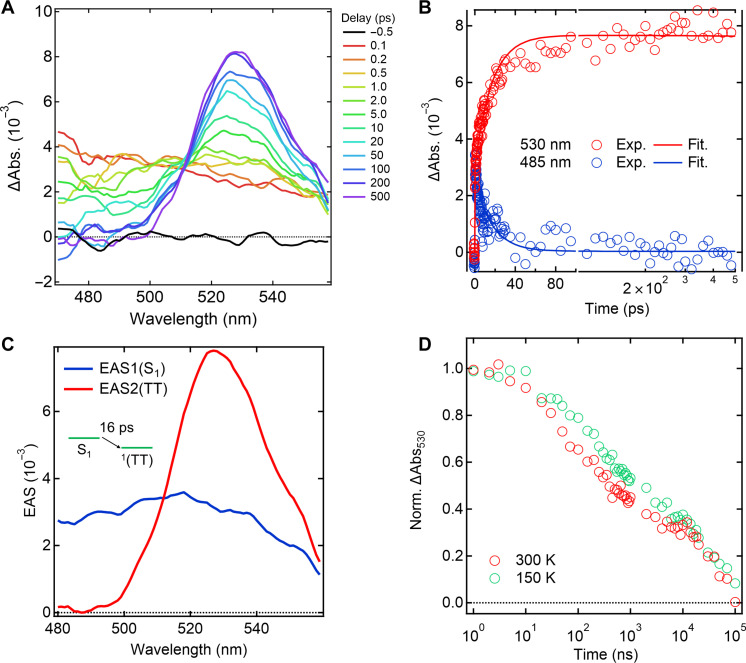
Fig. 3. TAS measurements of Pn-MOF.
(A) Experimentally observed spectral evolution of the femtosecond TAS (excitation wavelength, 600 nm) of Pn-MOF in paraffin. (B) Temporal change of transient absorption at selected wavelengths and fitting curves from global analysis. (C) EAS obtained from global analysis based on the sequential model based on two components. EAS1 and EAS2 indicate the first and second components of EAS, respectively. (D) Temperature dependence of the transient absorption at 530 nm of Pn-MOF.

