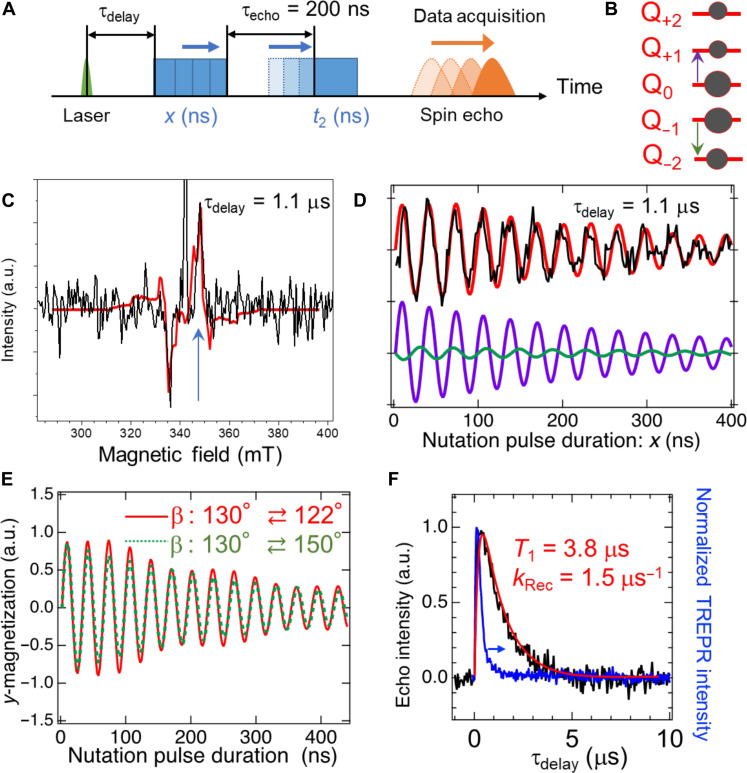
Fig. 6. Transient nutation of the quintet state at room temperature.
(A) Pulse sequence of the transient nutation measurement. (B) Two main quantum gates detected by the pulsed microwave at B0 = 348.1 mT in the quintet sublevels. (C) Echo-detected EPR spectrum at τdelay = 1.1 μs. The durations of the first and second pulses are x = 8 ns and t2 = 16 ns, respectively. Fitting result using eq. S15 and table S5 is shown as a red line. (D) Transient nutation profiles as a function of x in (A) at τdelay = 1.1 μs using t2 = 16 ns. The simulated profile is shown by a red line considering the anisotropic sublevel populations. At the bottom, decomposition of the computed nutation data by the gates Q0,±1 and Q±2,±1 are shown by purple and green lines, respectively. (E) Simulated profiles by the different rotation models. The red solid line corresponding to the red line in (D) is computed by the conformation motion between the dihedral angles of β = 130° and 122° of the TB molecule in the TATB pair for TT1 and TT2, respectively. Green dashed line is obtained with considering the large dihedral angle change between β = 130° and 150° in Fig. 4B. (F) Dependence of τdelay on the echo intensity (black line) employing x = 8 ns, t2 = 16 ns, and τecho = 200 ns with B1 = 0.45 mT together with delay time dependence of the CW-TREPR intensity at 351 mT in Fig. 4A (blue line). Fitting result using eq. S1 and table S5 is shown as a red line.

