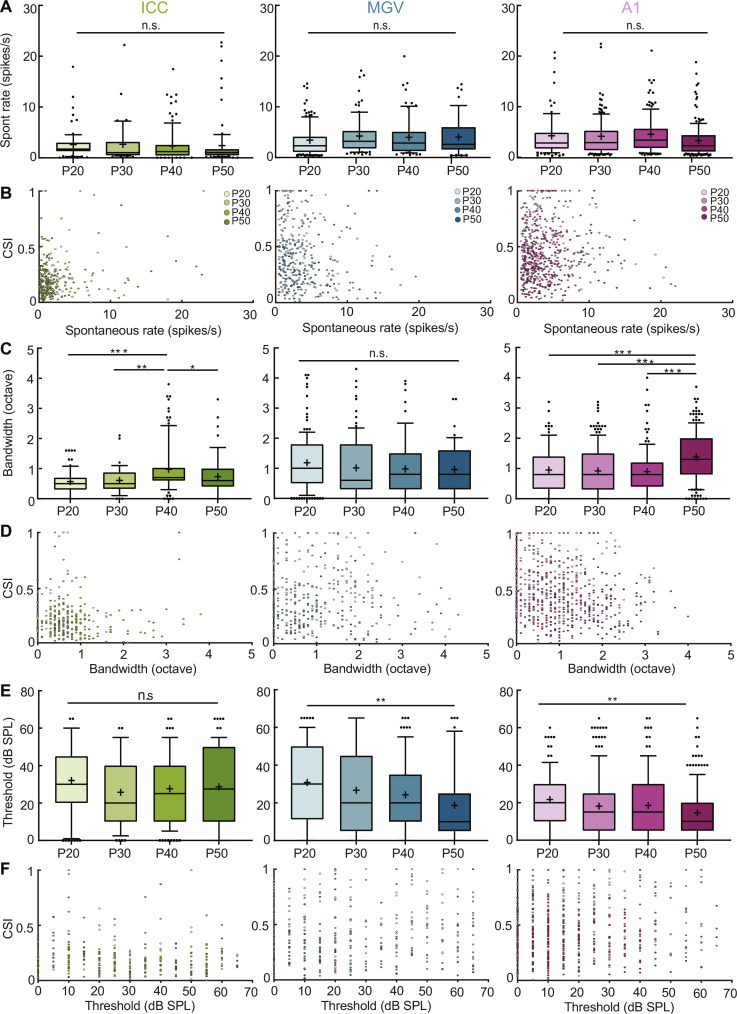
Fig. 3. SSA maturation does not correlate with changes in spontaneous activity, response bandwidth, or threshold.
(A) Spontaneous activity across adolescence in ICC, MGV, and A1. n.s., P > 0.05, one-way ANOVA with multiple comparisons. ICC: f = 0.14, df = 302; MGV: f = 0.91, df = 364; A1: f = 2.52, df = 615. (B) Scatter plot of CSI versus spontaneous activity across brain areas. (C) Tuning bandwidth at 60-dB SPL across adolescence in ICC, MGV, and A1. ICC: P20 versus P40, P = 0.0001; P40 versus P50, P = 0.0490. P30 versus P40, P = 0.0063. MGV: n.s., P > 0.05. A1: P20 versus P50, P = 0.0003; P30 versus P50, P < 0.0001; P40 versus P50, P < 0.0001; one-way ANOVA with multiple comparisons. ICC: f = 7.48, df = 302; MGV: f = 1.24, df = 363; A1: f = 14.52, df = 603. (D) Scatter plot of CSI versus bandwidth across brain areas. (E) Response threshold across adolescence in ICC, MGV, and A1. ICC: n.s., P > 0.05. MGV: P20 versus P50, P = 0.0043. A1: P20 versus P50, P = 0.0012; one-way ANOVA with multiple comparisons. ICC: f = 1.18, df = 302; MGV: f = 4.45, df = 364; A1: f = 4.68, df = 615. (F) Scatter plot of CSI versus threshold across brain areas. For all panels, n as in Fig. 1. See table S1 for Pearson correlations of (B), (D), and (F). In the boxplots, lines represent median, 25th, and 75th percentiles, + represents mean, whiskers represent 10th and 90th percentiles, and points below or above the whiskers are drawn as individual points. *P < 0.05; **P < 0.01; ***P < 0.001.

