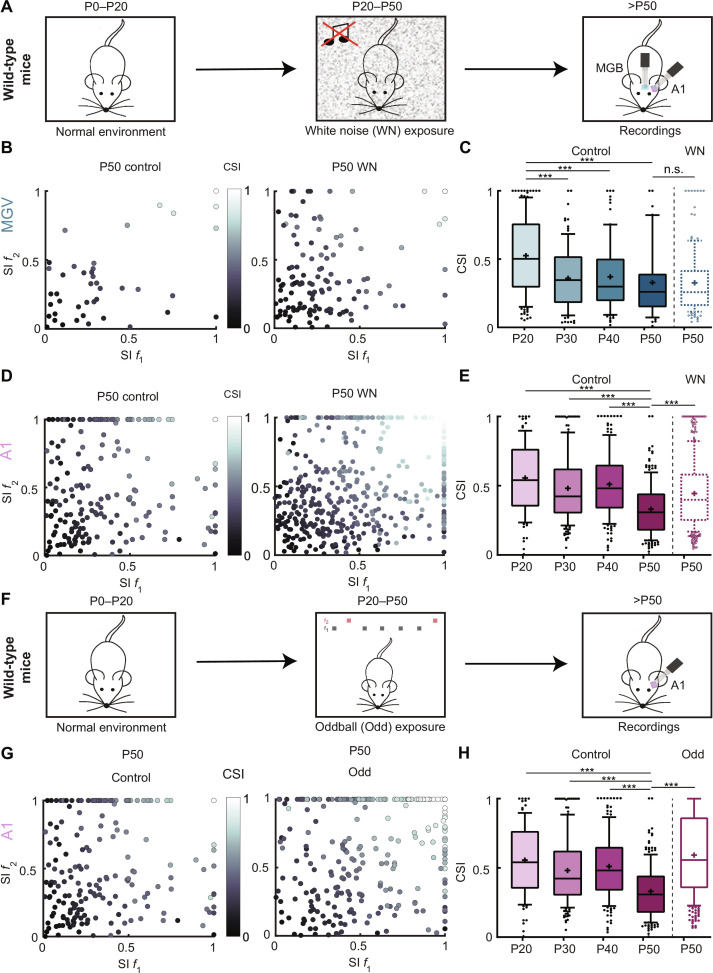
Fig. 4. Auditory experience affects SSA maturation in A1 but not in MGV.
(A) Schematic of mouse postnatal development continuous WN exposure. P0 to P20, mice reared in normal acoustic environment; P20 to P50, exposure to continuous WN; after P50, MGV and A1 extracellular electrophysiological recordings. (B) Scatter plot of SI f1 and SI f2 for MGV P50 control (left; as in fig. S2A) and WN-exposed P50 (right). (C) Average CSI for control MGV P20, P30, P40, and P50 (n as in Fig. 1G) and WN-exposed P50 (5 mice, 132 units). Control P20 versus P30/P40/P50, ***P < 0.0001; control P50 versus WN P50, n.s., P < 0.05. (D) Scatter plot of SI f1 and SI f2 for A1 P50 control (left; n as in fig. S2A) and WN-exposed P50 (right). (E) Averaged CSI for control A1 P20, P30, P40, and P50 (n as in Fig. 1H) and WN-exposed P50 (7 mice, 448 units). Control P20/P30/P40 versus P50, ***P < 0.0001; control P50 versus WN P50, ***P < 0.0001. (F) Schematic of mouse postnatal development oddball (Odd) exposure. P0 to P20, mice reared in normal acoustic environment; P20 to P50, exposure to oddball paradigm with fixed f1 and f2; after P50, A1 extracellular electrophysiological recordings. (G) Scatter plot of SI f1 and SI f2 for A1 P50 control (left; as in fig. S2A) and Odd-exposed P50 (right). (H) Average CSI for control A1 P20, P30, P40, and P50 (n as in Fig. 1H) and Odd-exposed P50 (4 mice, 306 units). Control P20 versus P30/P40/P50, ***P < 0.0001; control P50 versus Odd P50, ***P < 0.0001; one-way ANOVA with multiple comparisons for each area across age and unpaired t test to compare across exposure. In the boxplots, lines represent median, 25th, and 75th percentiles, + represents mean, whiskers represent 10th and 90th percentiles, and points below or above the whiskers are drawn as individual points.

