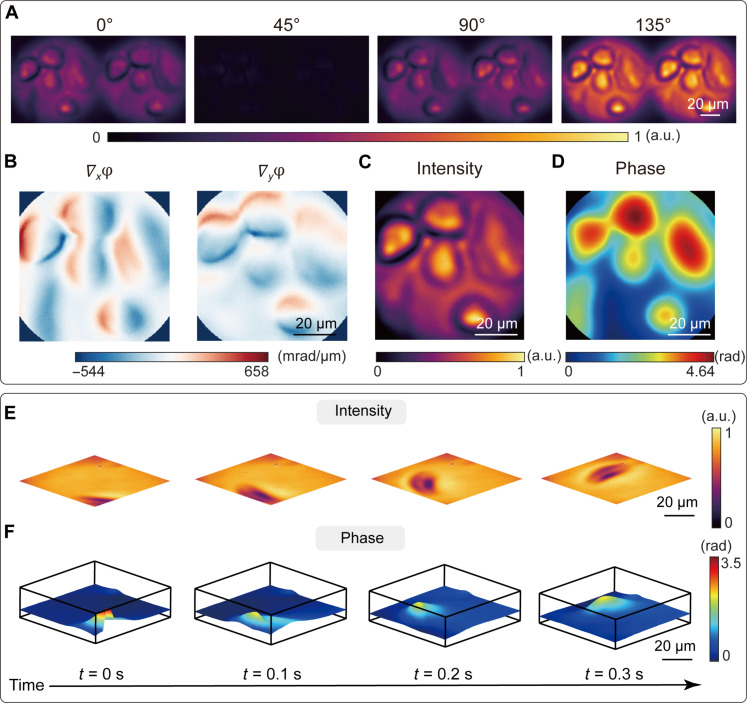
Fig. 5. Complex amplitude microscopy for living cells.
(A) Captured shearing interference images of living cancer cell MDA-MB-468 with the polarization channel along 0°, 45°, 90°, and 135°, respectively. (B) Calculated phase gradients along the x and y direction, respectively. (C) Reconstructed intensity image of the living cancer cells from the sum of 0° and 90° polarized light intensity. (D) Reconstructed phase distribution of the living cancer cells. (E and F) Selected frames of the measured intensity (E) and phase (F) distribution of the moving paramecium captured at a video frame rate of 10 Hz.

