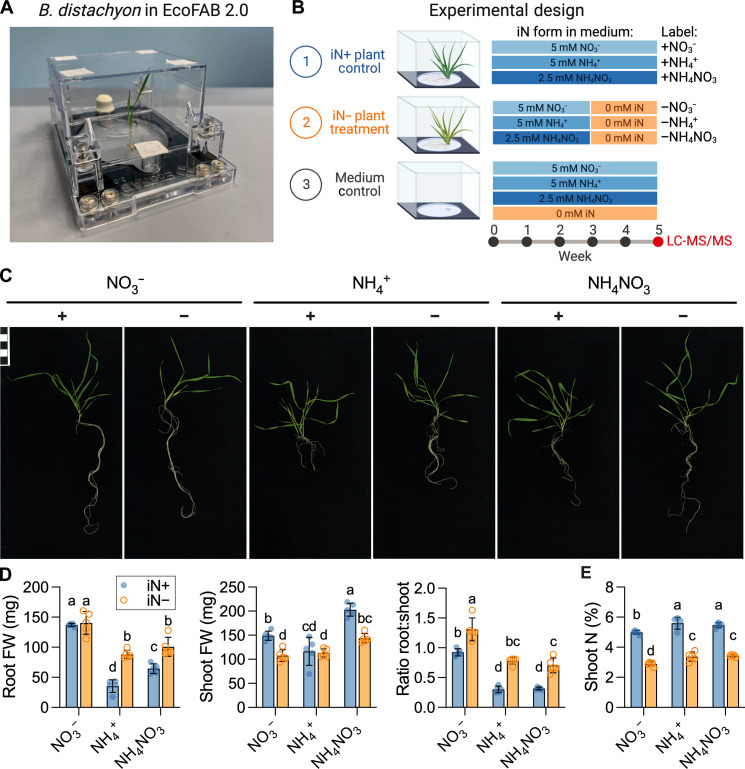
Fig. 1. Analysis of plant biomass grown in EcoFAB 2.0.
(A) An example of EcoFAB 2.0 containing hydroponically grown B. distachyon BD21-3 seedling. (B) Design of the plant growth experiment. B. distachyon Bd21-3 grew in EcoFAB 2.0 devices for 5 weeks with weekly medium changes. Control iN+ plants (blue) received 5 mM iN as nitrate (+NO3−), ammonium (+NH4−), or ammonium nitrate (NH4NO3), while the plants in the iN− treatment group (orange) were transferred to iN− medium (−NO3−, −NH4+, or −NH4NO3) after 3 weeks. The EcoFABs 2.0 filled with growth medium without plants were used as technical controls. Each iN treatment had five biological replicates. We sampled plant spent medium for exudate analysis by LC-MS/MS at week 5. The figure was created with BioRender.com. (C) The phenotypes of 5-week-old B. distachyon grown on different iN forms. The iN+ controls are marked with plus signs (+), and the iN− treatments with minus signs (−). The scale bar in the top left indicates 1 cm × 1 cm. All phenotype pictures are available at https://doi.org/10.6084/m9.figshare.21376017. (D) Fresh weight (FW) of roots, shoots, and their ratio. (E) Total nitrogen in dry shoot weight (%, w/w). Different letters indicate statistically significant differences [two-way analysis of variance (ANOVA) with Tukey’s post hoc test; n = 5; P ≤ 0.05]. Blue-shaded circles show control iN+ plants, while orange circles indicate iN− plants.

