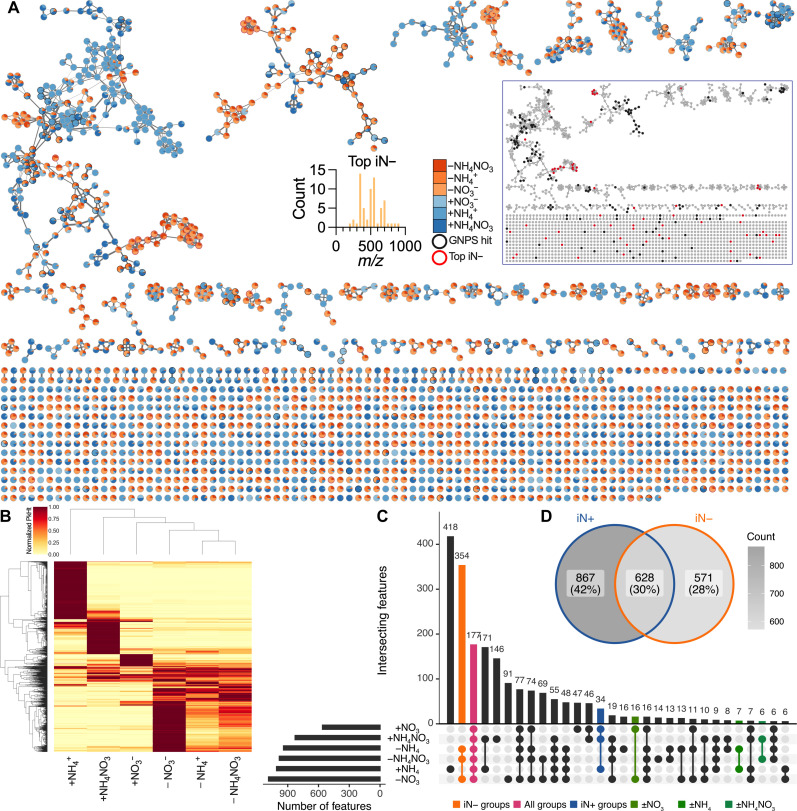
Fig. 3. Filtered features detected by polar metabolomics in B. distachyon exudates under varying iN supply in EcoFAB 2.0.
(A) Feature-based molecular networking (merged polarities, n = 2065). Edge widths increase with the cosine score. Pie charts show the mean peak heights of iN+ (blue gradient) and iN− (orange gradient) treatments. The black bordered nodes signify GNPS-annotated features (MQScore > 0.7), while the red bordered nodes show 65 features that increased >1000-fold in N deficiency (top iN−). Most top iN− features have m/z > 300. Note no GNPS annotations for the top iN− features. The inset network shows low proximity of the top iN− features (red nodes) to GNPS features (black nodes), thus prohibiting their mass-shift identification. The high-resolution interactive network is available via Network Data Exchange (NDEx) at https://doi.org/10.18119/N9FW3X. (B) The heatmap shows hierarchical clustering of the filtered features normalized to the maximum average peak intensity across N treatments. (C) The UpSet plot shows the number of shared filtered features across the iN treatments among the first 30 largest intersecting sets. The second largest intersection of 354 features was across iN− treatments (orange), 177 features were shared across all iN groups (pink), and 34 features were shared within the iN+ group (blue), while a relatively low number of features were shared between the individual iN+ treatments and their iN− counterparts (greens). (D) Venn diagram shows feature intersections between grouped iN+ versus iN− treatments.

