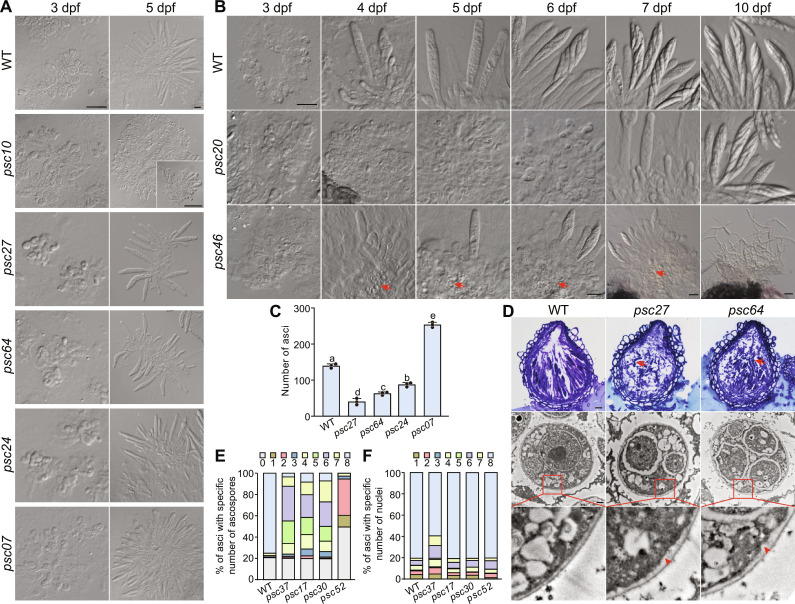
Fig. 2. Defects in different stages of germ tissue development in deletion mutants of PSC pseudogenes.
(A) Ascogenous hyphae and fascicles of asci observed by differential interference contrast microscopy after squeezing the 3- or 5-dpf perithecia of the marked strains. Scale bar, 20 μm. (B) Time-course observations of germ tissue development in perithecia of the marked strains. Scale bar, 20 μm. Red arrows indicate degraded cells. (C) The number of asci per perithecium produced by the marked strains at 5 dpf. Mean and SD were calculated with data from three independent replicates (n = 3), each with at least 17 perithecia examined. Different letters indicate significant differences based on one-way ANOVA followed by Turkey’s multiple range test (P < 0.05). (D) Microscopic observations of the marked strains after semithin (top; scale bar, 20 μm) and ultrathin sectioning (bottom; scale bar, 500 nm). Red arrows indicate the germinated ascospores; red arrowheads indicate the thickened inner face of the ascus walls. (E and F) The percentage of asci containing a specific number of ascospores in the marked strains at 7 dpf (E) or nuclei in the marked strains at 5 dpf (F). The data are presented as the mean calculated from three independent replicates (n = 3), each with at least 80 asci examined.

