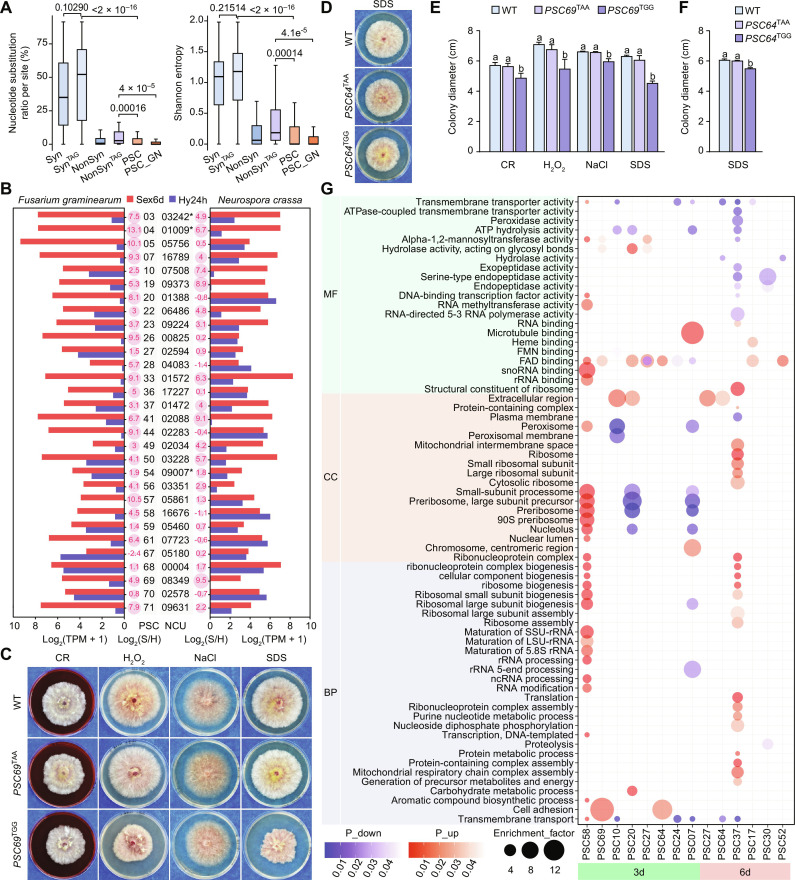
Fig. 5. Adaptive advantages of PSC editing.
(A) Boxplots comparing the nucleotide substitution frequency and Shannon entropy at each site in descendant species of the last common ancestor of F. graminearum and F. neocosmosporiellum among different groups. These groups include 44 shared PSC-editing sites (PSC_GN), 77 shared synonymous (Syn) and nonsynonymous (NonSyn) editing sites each, and 77 shared synonymous (SynTAG) and nonsynonymous (NonSynTAG) editing sites with a TAG triplet each between F. graminearum and F. neocosmosporiellum, as well as all 77 PSC-editing sites (PSC) in F. graminearum. P values from the two-tailed Wilcoxon rank sum test with continuity correction are indicated. (B) Expression levels [Log2(TPM + 1)] of PSC pseudogene orthologs in F. graminearum and N. crassa during sexual reproduction (Sex6d) and vegetative growth (Hyp24h). The expression ratio of Sex6d compared with Hyp24h is shown as bubble maps with Log2(S/H) values. The star (*) indicates that the gene in N. crassa is also a PSC pseudogene. (C and D) Colonies of PH-1 (WT) and the uneditable (TAA) and edited (TGG) transformants of PSC69 and PSC64 formed on potato dextrose agar (PDA) with or without Congo red (150 μg/ml), 0.05% H2O2, 0.7 M NaCl, and 0.01% SDS after incubation for 3 or 5 days. (E and F) Colony diameters of the marked strains. Mean and SD were calculated with data from three biological replicates (n = 3). Different letters indicate significant differences based on one-way ANOVA followed by Turkey’s multiple range test (P < 0.05). (G) Enriched Gene Ontology (GO) terms in up- or down-regulated DEGs of each sample. MF, molecular function; CC, cell component; BP, biological process.

