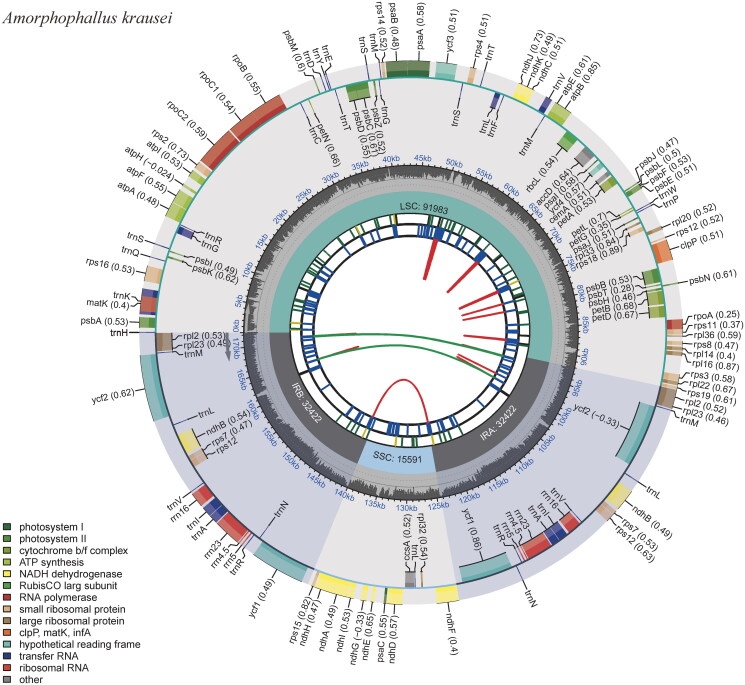
Figure 2.
The circular map of the chloroplast genome of Amorphophallus krausei produced by the software CPGVIEW. Genes belonging to different functional groups are plotted in the outer circle. The functional classification of the genes is shown at the left bottom. The dark gray in the inner circle indicates the GC content of the chloroplast genome. The quadripartite structure, which consists of the LSC, the SSC, and two IR regions, is shown. The inner track shows the forward and reverse repeats connected with red and green arcs.

