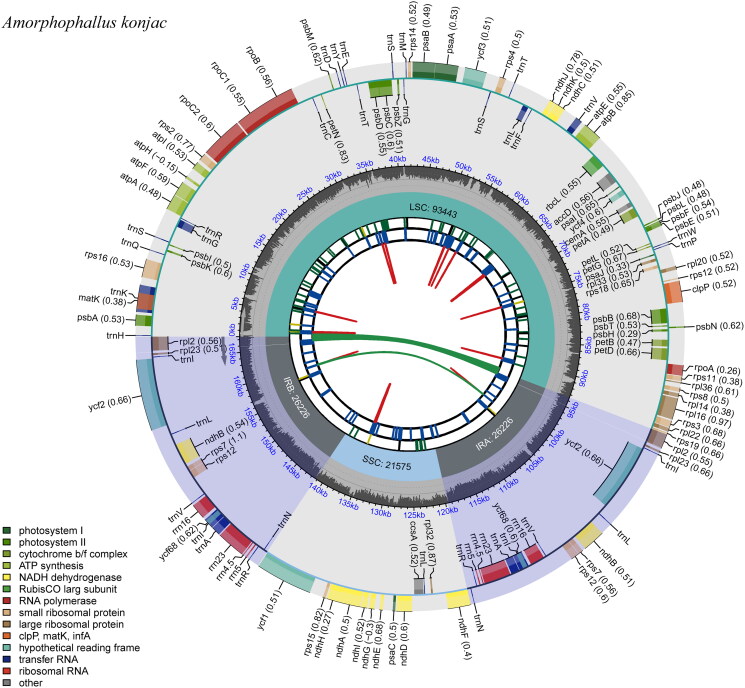
Figure 2.
The chloroplast genome map of Amorphophallus konjac. From the center, the first track shows the dispersed repeats, including direct repeats (red) and palindromic repeats (green). The second and third tracks show the long and short tandem repeats, respectively. The small single-copy (SSC), inverted repeat (IRa and IRb), and large single-copy (LSC) regions are shown on the fourth track. The GC content along the genome is plotted in the fifth track. The genes are shown on the sixth track.

